| Investor Day Nov. 11. 2021 |

| Confidential. © 2021 Digital Turbine, Inc. | 2 Safe Harbor Statement This presentation includes "forward-looking statements" within the meaning of the U.S. federal securities laws. Statements in this presentation that are not statements of historical fact and that concern future results from operations, financial position, economic conditions, product releases and any other statement that may be construed as a prediction of future performance or events, including financial projections and growth in various products, are forward-looking statements that speak only as of the date made and which involve known and unknown risks, uncertainties and other factors which may, should one or more of these risks, uncertainties or other factors materialize, cause actual results to differ materially from those expressed or implied by such statements. These factors and risks include risks associated with adoption of the Company’s platform among existing customers (including the impact of possible delays with major carrier and OEM partners in the roll out for mobile phones deploying the Company’s platform); actual mobile device sales and sell-through where the Company’s platform is deployed is out of the Company’s control; new customer adoption and time to revenue with new carrier and OEM partners is subject to delays and factors out of the Company’s control; risks associated with fluctuations in the number of the Company’s platform slots across US carrier partners; the challenges, given the Company’s comparatively small size, to expand the combined Company's global reach, accelerate growth and create a scalable, low-capex business model that drives EBITDA (as well as Adjusted EBITDA); varying and often unpredictable levels of orders; the challenges inherent in technology development necessary to maintain the Company's competitive advantage such as adherence to release schedules and the costs and time required for finalization and gaining market acceptance of new products; changes in economic conditions and market demand; rapid and complex changes occurring in the mobile marketplace; pricing and other activities by competitors; technology management risk as the Company needs to adapt to complex specifications of different carriers and the management of a complex technology platform given the Company's relatively limited resources; a decline in general economic conditions nationally and internationally; market acceptance and brand awareness of the Company’s products; risks associated with indebtedness and the ability to comply with financial covenants on outstanding indebtedness; the ability to protect the Company’s intellectual property rights; the impact of COVID-19 on the Company’s results of operations; risks associated with new privacy laws, such as the European Union’s GDPR and similar laws which may require changes to the Company’s development and user interface for certain functionality of the Company’s mobile platform; risks associated with the activities of advertisers; customer adoption that either the Company or the market may expect; ability as a smaller company to manage international operations; system security and cyberattacks; risks and uncertainties associated with the integration of AdColony, including the Company’s ability to realize the anticipated benefits of the acquisition; risks and uncertainties associated with the integration of the acquisition of Fyber, including the Company’s ability to realize the anticipated benefits of the acquisition and the satisfaction of related earn-out provisions; risks associated with the failure or inability to pay the future consideration due in the AdColony and Fyber acquisitions; challenges and risks associated with the Company’s rapid growth by acquisitions and resulting significant demands on the Company’s management and infrastructure; challenges and risks associated with the Company’s global operations and related business, political, regulatory, operational, financial, and economic risks as a result of the Company’s global operations; and other risks including those described from time to time in Digital Turbine's filings on Forms 10-K and 10-Q with the Securities and Exchange Commission (SEC), press releases and other communications. You should not place undue reliance on these forward-looking statements. The Company does not undertake to update forward-looking statements, whether as a result of new information, future events or otherwise, except as required by law. |
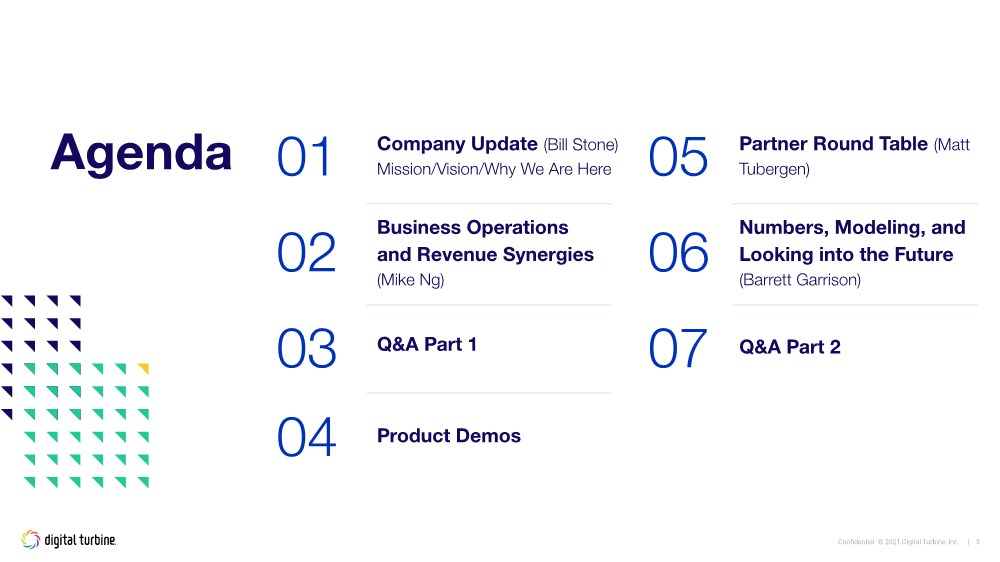
| Confidential. © 2021 Digital Turbine, Inc. | 3 Agenda 01 02 Business Operations and Revenue Synergies (Mike Ng) 03 Q&A Part 1 04 Product Demos Company Update (Bill Stone) Mission/Vision/Why We Are Here 06 Numbers, Modeling, and Looking into the Future (Barrett Garrison) 07 Q&A Part 2 05 Partner Round Table (Matt Tubergen) |
| The Company Bill Stone |
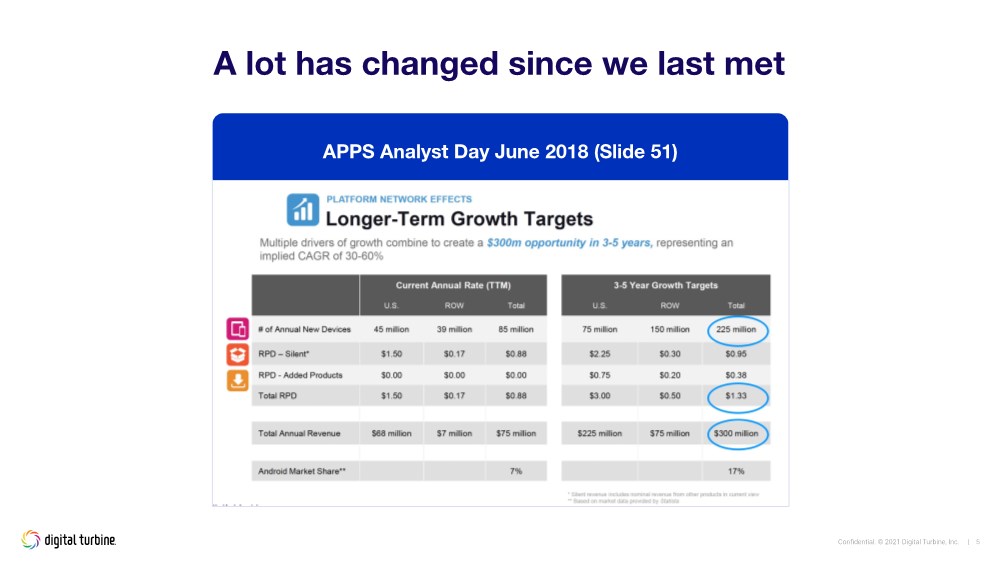
| Confidential. © 2021 Digital Turbine, Inc. | 5 A lot has changed since we last met APPS Analyst Day June 2018 (Slide 51) |
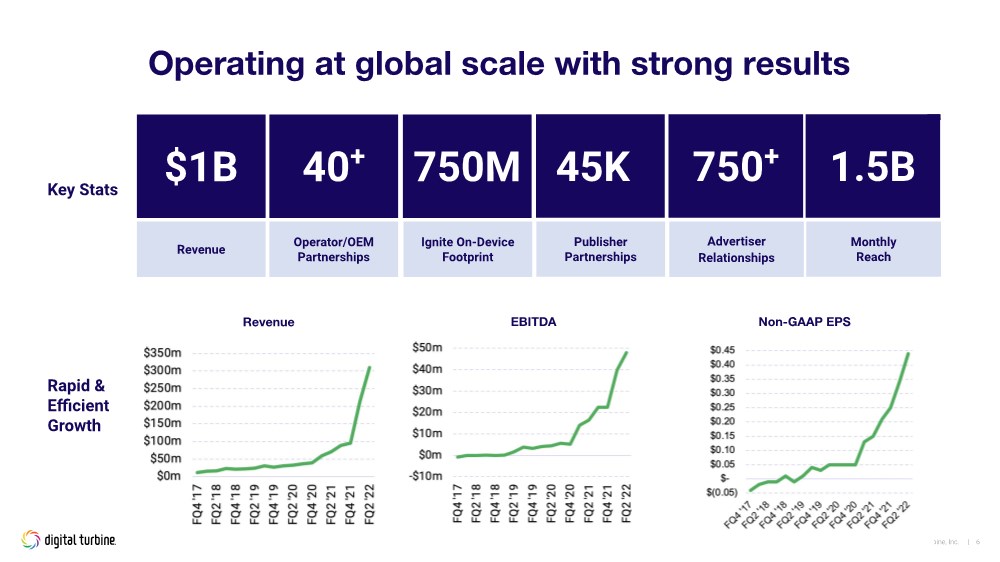
| Confidential. © 2021 Digital Turbine, Inc. | 6 Operating at global scale with strong results Key Stats Rapid & Efficient Growth Non-GAAP EPS EBITDA Revenue 40+ 45K+ Operator/OEM Partnerships Publisher Partnerships 750M Ignite On-Device Footprint $1B Revenue Advertiser Relationships Monthly Reach 750+ 1.5B |
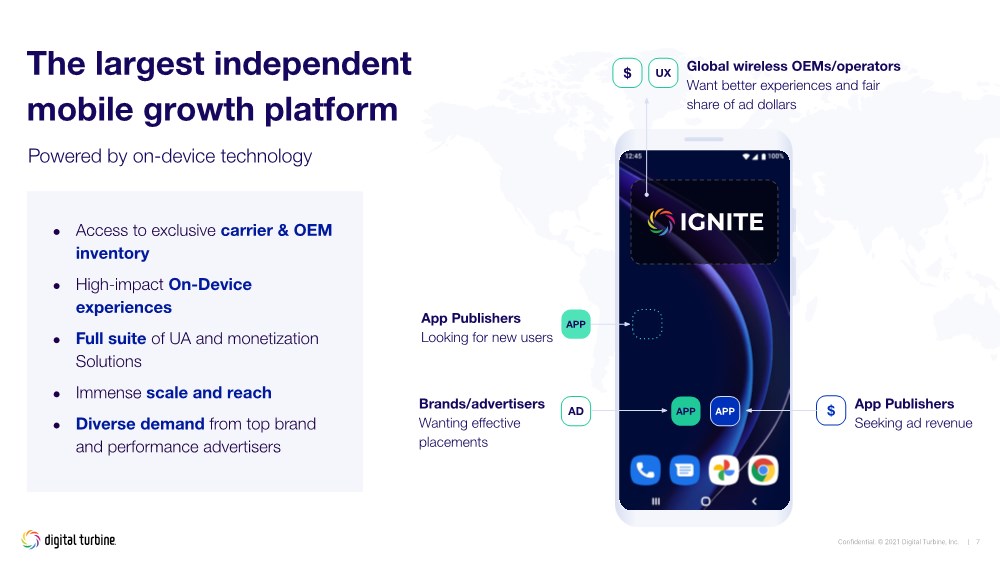
| Confidential. © 2021 Digital Turbine, Inc. | 7 The largest independent mobile growth platform Powered by on-device technology APP APP $ AD App Publishers Seeking ad revenue $ UX Global wireless OEMs/operators Want better experiences and fair share of ad dollars Brands/advertisers Wanting effective placements APP App Publishers Looking for new users ● Access to exclusive carrier & OEM inventory ● High-impact On-Device experiences ● Full suite of UA and monetization Solutions ● Immense scale and reach ● Diverse demand from top brand and performance advertisers |
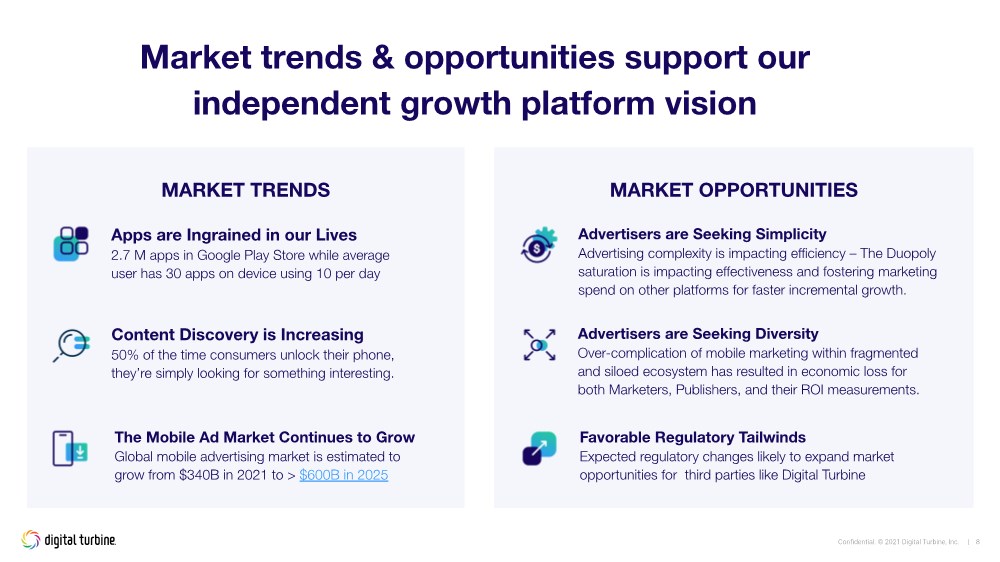
| Confidential. © 2021 Digital Turbine, Inc. | 8 Market trends & opportunities support our independent growth platform vision Apps are Ingrained in our Lives 2.7 M apps in Google Play Store while average user has 30 apps on device using 10 per day Content Discovery is Increasing 50% of the time consumers unlock their phone, they’re simply looking for something interesting. MARKET TRENDS The Mobile Ad Market Continues to Grow Global mobile advertising market is estimated to grow from $340B in 2021 to > $600B in 2025 Favorable Regulatory Tailwinds Expected regulatory changes likely to expand market opportunities for third parties like Digital Turbine Advertisers are Seeking Diversity Over-complication of mobile marketing within fragmented and siloed ecosystem has resulted in economic loss for both Marketers, Publishers, and their ROI measurements. Advertisers are Seeking Simplicity Advertising complexity is impacting efficiency – The Duopoly saturation is impacting effectiveness and fostering marketing spend on other platforms for faster incremental growth. MARKET OPPORTUNITIES |
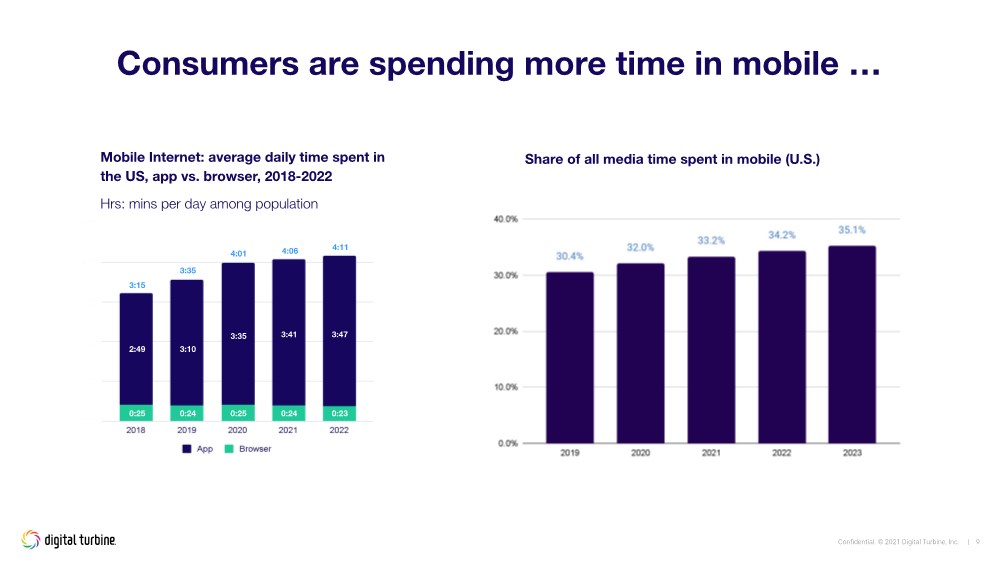
| Confidential. © 2021 Digital Turbine, Inc. | 9 Consumers are spending more time in mobile … 0:25 2:49 0:24 3:10 0:25 3:35 0:24 3:41 0:23 3:47 3:15 3:35 4:01 4:06 4:11 Mobile Internet: average daily time spent in the US, app vs. browser, 2018-2022 Hrs: mins per day among population Share of all media time spent in mobile (U.S.) |
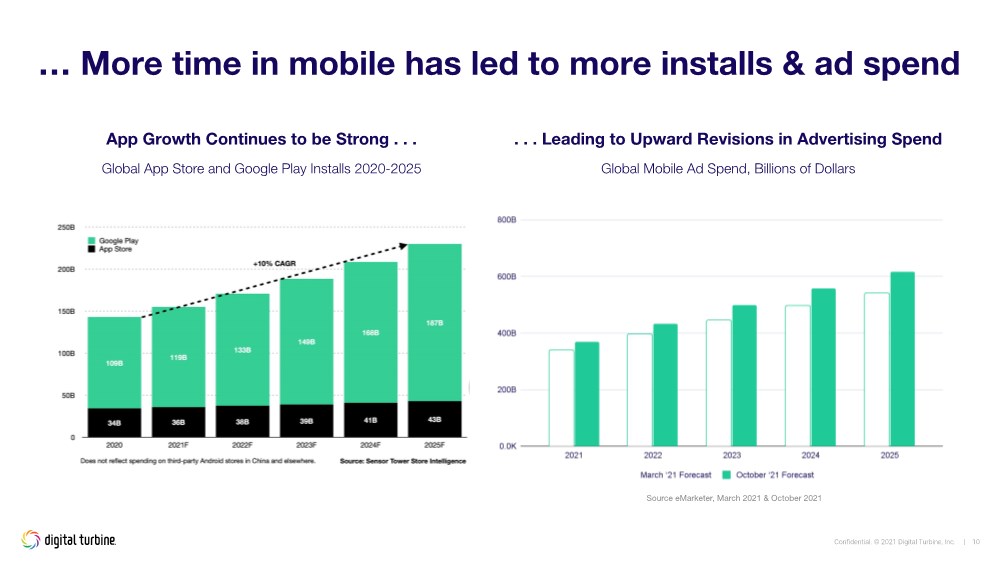
| Confidential. © 2021 Digital Turbine, Inc. | 10 … More time in mobile has led to more installs & ad spend Source eMarketer, March 2021 & October 2021 .. . . Leading to Upward Revisions in Advertising Spend Global Mobile Ad Spend, Billions of Dollars App Growth Continues to be Strong . . . Global App Store and Google Play Installs 2020-2025 |
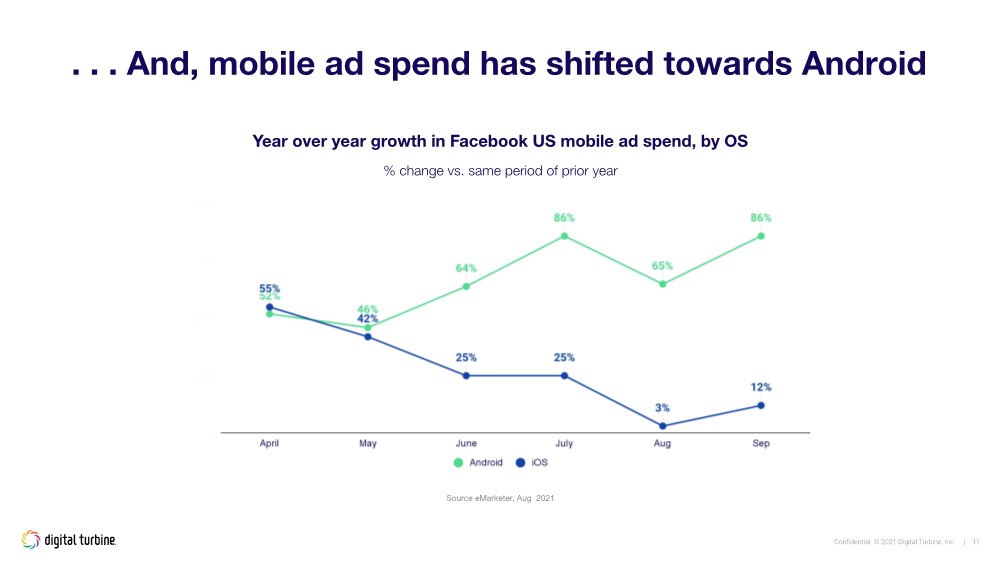
| Confidential. © 2021 Digital Turbine, Inc. | 11 .. . . And, mobile ad spend has shifted towards Android Year over year growth in Facebook US mobile ad spend, by OS % change vs. same period of prior year Source eMarketer, Aug 2021 |
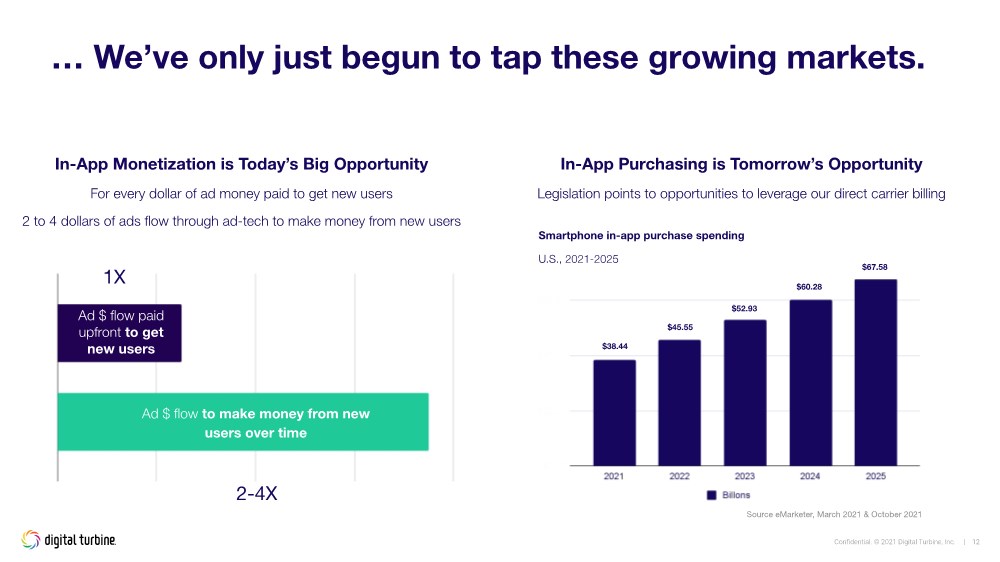
| Confidential. © 2021 Digital Turbine, Inc. | 12 … We’ve only just begun to tap these growing markets. Advertising MADE Ad $ flow to make money from new users over time Ad $ flow paid upfront to get new users In-App Monetization is Today’s Big Opportunity For every dollar of ad money paid to get new users 2 to 4 dollars of ads flow through ad-tech to make money from new users Source eMarketer, March 2021 & October 2021 In-App Purchasing is Tomorrow’s Opportunity Legislation points to opportunities to leverage our direct carrier billing $38.44 $45.55 $52.93 $60.28 $67.58 Smartphone in-app purchase spending U.S., 2021-2025 1X 2-4X |
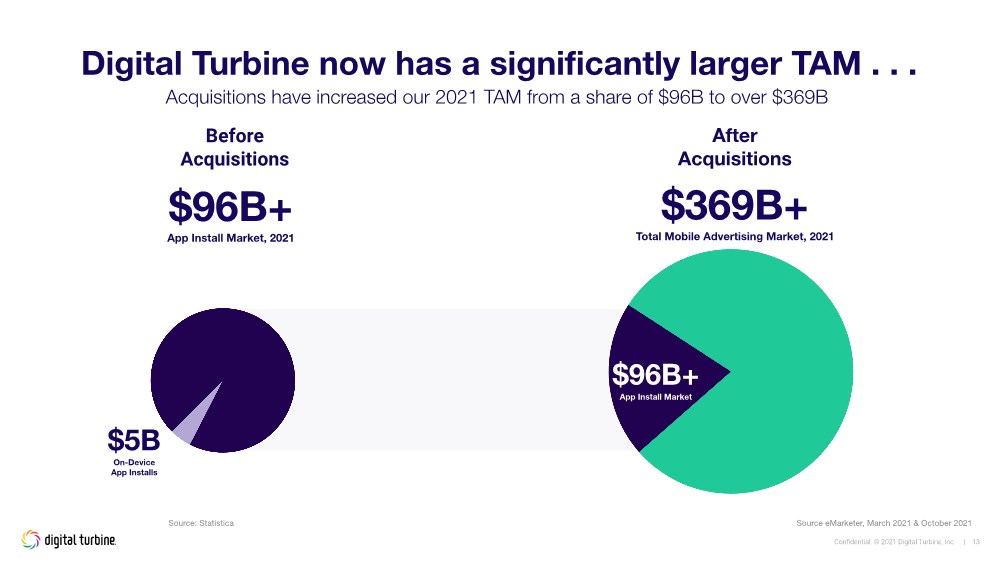
| Confidential. © 2021 Digital Turbine, Inc. | 13 Digital Turbine now has a significantly larger TAM . . . Acquisitions have increased our 2021 TAM from a share of $96B to over $369B After Acquisitions Before Acquisitions $96B+ App Install Market $96B+ App Install Market, 2021 $369B+ Total Mobile Advertising Market, 2021 $5B On-Device App Installs Source: Statistica Source eMarketer, March 2021 & October 2021 |
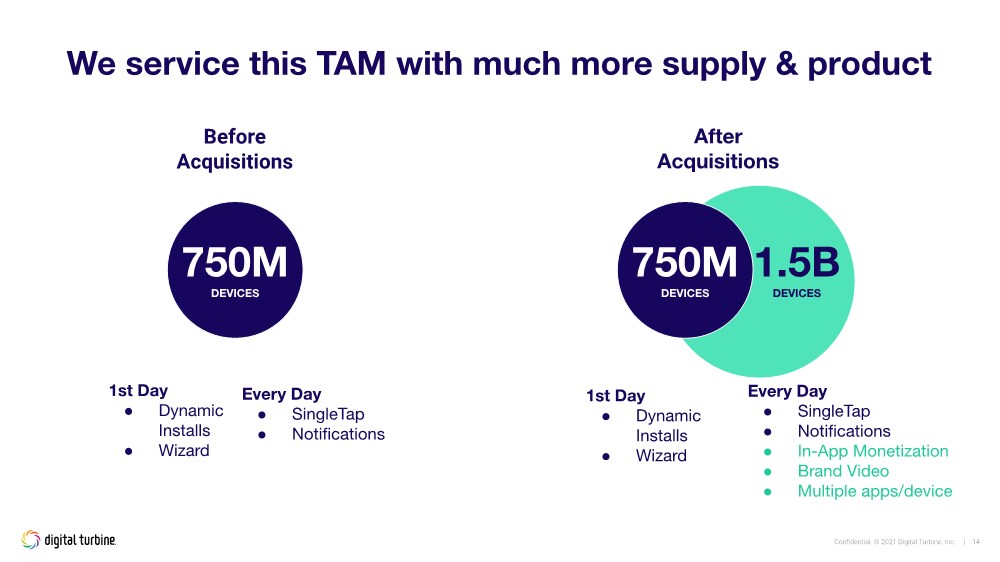
| Confidential. © 2021 Digital Turbine, Inc. | 14 We service this TAM with much more supply & product 1st Day ● Dynamic Installs ● Wizard After Acquisitions Before Acquisitions 750M DEVICES 750M DEVICES 1.5B DEVICES 1st Day ● Dynamic Installs ● Wizard Every Day ● SingleTap ● Notifications ● In-App Monetization ● Brand Video ● Multiple apps/device Every Day ● SingleTap ● Notifications |
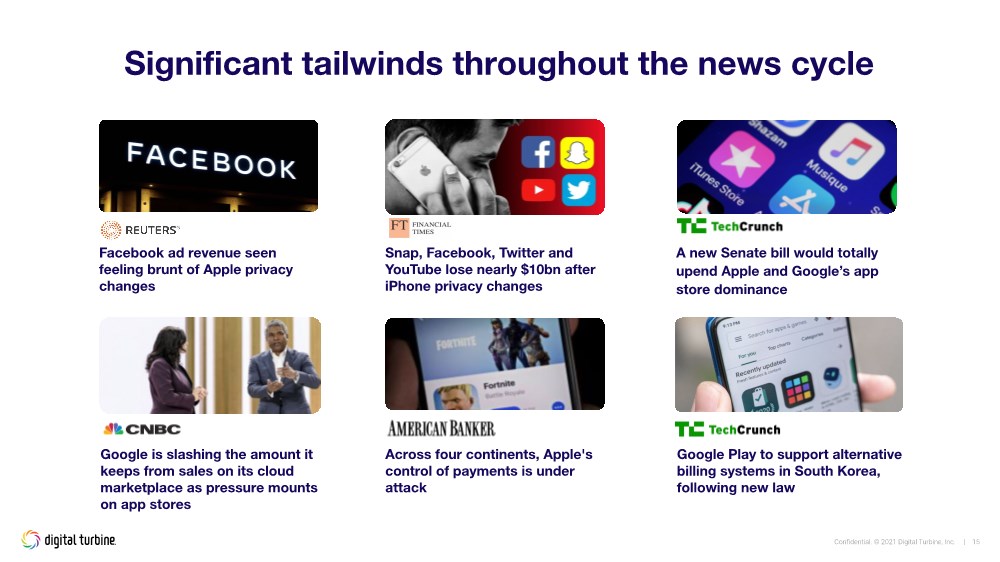
| Confidential. © 2021 Digital Turbine, Inc. | 15 Significant tailwinds throughout the news cycle A new Senate bill would totally upend Apple and Google’s app store dominance Across four continents, Apple's control of payments is under attack Facebook ad revenue seen feeling brunt of Apple privacy changes Snap, Facebook, Twitter and YouTube lose nearly $10bn after iPhone privacy changes Google Play to support alternative billing systems in South Korea, following new law Google is slashing the amount it keeps from sales on its cloud marketplace as pressure mounts on app stores |
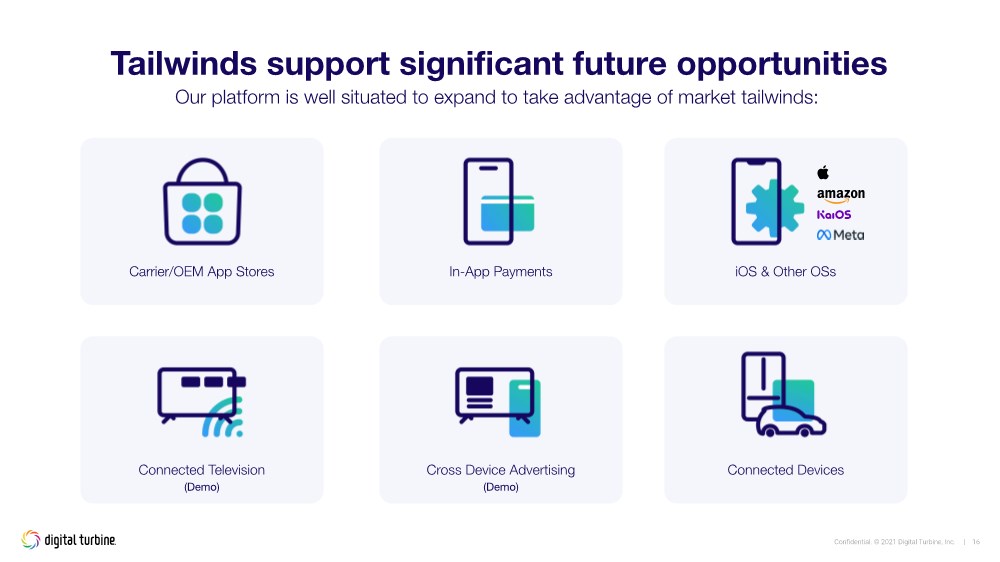
| Confidential. © 2021 Digital Turbine, Inc. | 16 Carrier/OEM App Stores Tailwinds support significant future opportunities Our platform is well situated to expand to take advantage of market tailwinds: In-App Payments iOS & Other OSs Connected Television (Demo) Cross Device Advertising (Demo) Connected Devices |
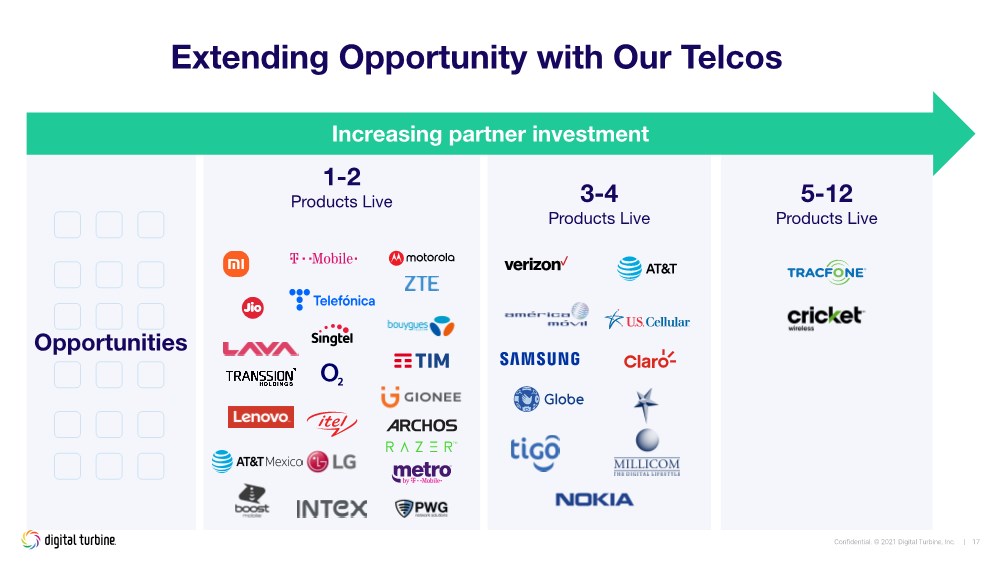
| Confidential. © 2021 Digital Turbine, Inc. | 17 3-4 Products Live Opportunities 1-2 Products Live 5-12 Products Live Extending Opportunity with Our Telcos Increasing partner investment |
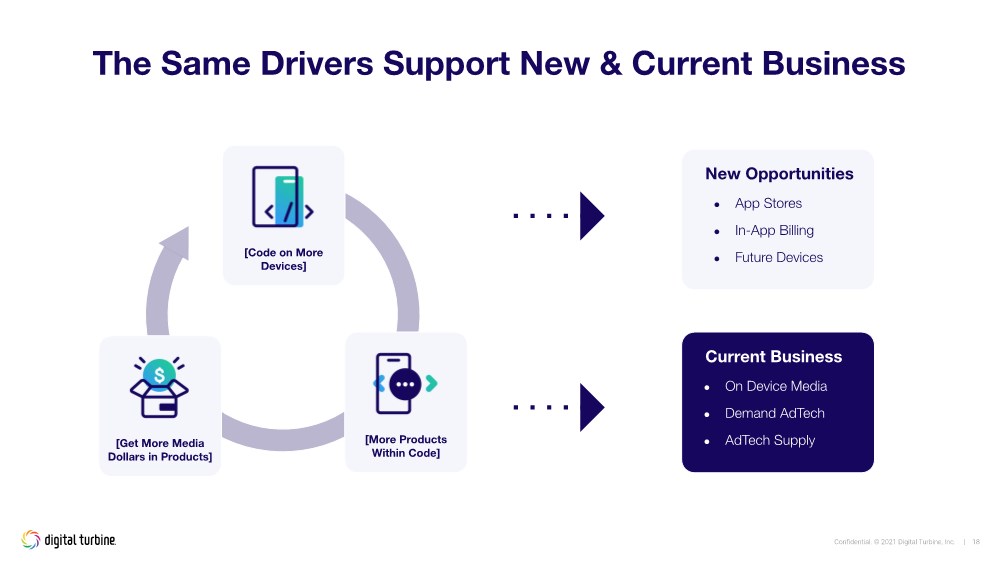
| Confidential. © 2021 Digital Turbine, Inc. | 18 The Same Drivers Support New & Current Business Current Business ● On Device Media ● Demand AdTech ● AdTech Supply New Opportunities ● App Stores ● In-App Billing ● Future Devices [Get More Media Dollars in Products] [More Products Within Code] [Code on More Devices] |
| Business Operations and Revenue Synergies Mike Ng |
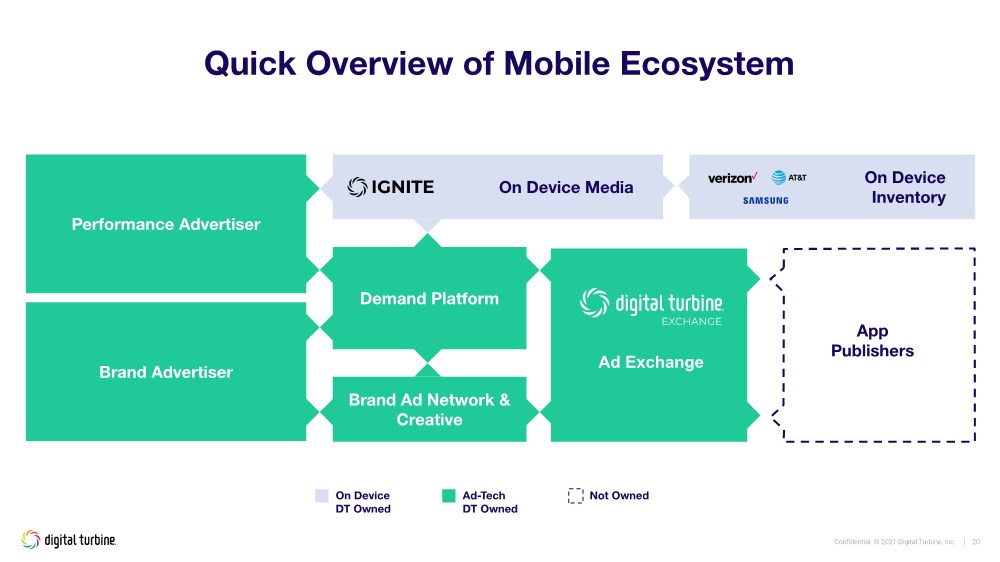
| Confidential. © 2021 Digital Turbine, Inc. | 20 Quick Overview of Mobile Ecosystem Brand Advertiser Performance Advertiser Brand Ad Network & Creative On Device Media On Device Inventory Demand Platform On Device DT Owned Ad-Tech DT Owned Not Owned App Publishers Ad Exchange |
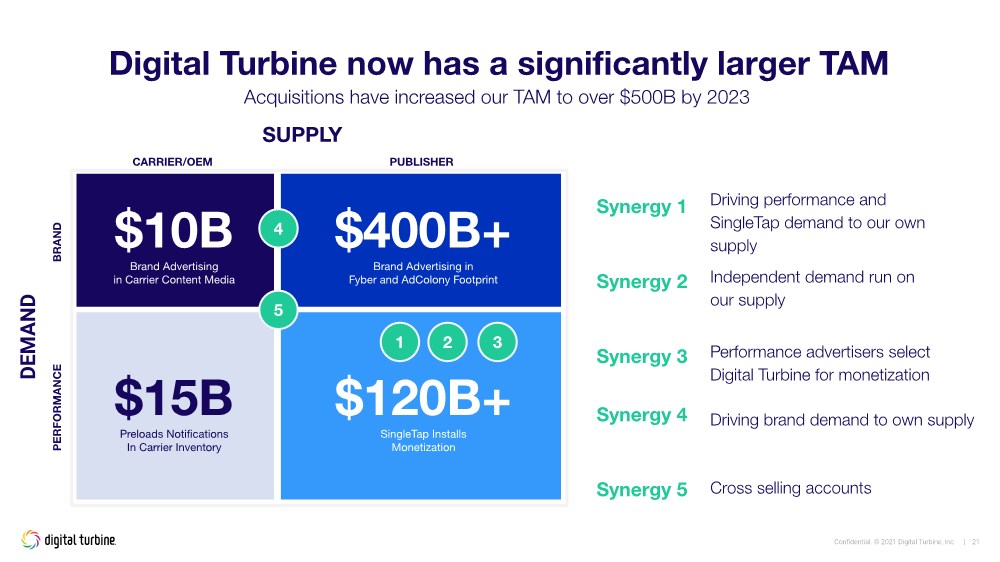
| Confidential. © 2021 Digital Turbine, Inc. | 21 Digital Turbine now has a significantly larger TAM Acquisitions have increased our TAM to over $500B by 2023 SUPPLY DEMAND CARRIER/OEM BRAND $10B Brand Advertising in Carrier Content Media PUBLISHER $400B+ Brand Advertising in Fyber and AdColony Footprint $120B+ SingleTap Installs Monetization 1 Driving performance and SingleTap demand to our own supply Synergy 1 2 Independent demand run on our supply Synergy 2 PERFORMANCE $15B Preloads Notifications In Carrier Inventory 4 Driving brand demand to own supply Synergy 4 5 Cross selling accounts Synergy 5 Synergy 3 Performance advertisers select Digital Turbine for monetization 3 |
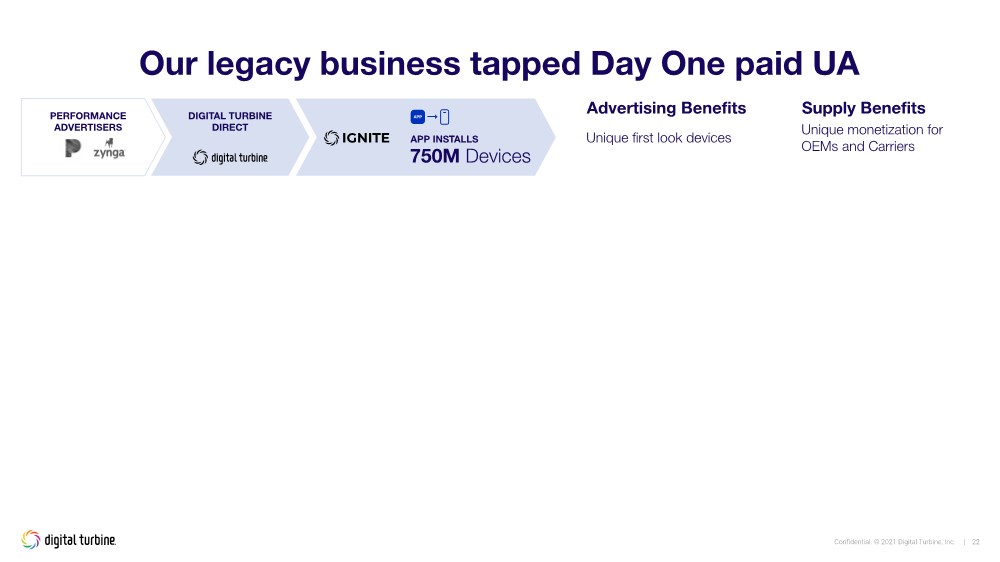
| Confidential. © 2021 Digital Turbine, Inc. | 22 Our legacy business tapped Day One paid UA PERFORMANCE ADVERTISERS Advertising Benefits Supply Benefits DIGITAL TURBINE DIRECT Unique first look devices 750M Devices Unique monetization for OEMs and Carriers APP INSTALLS APP |
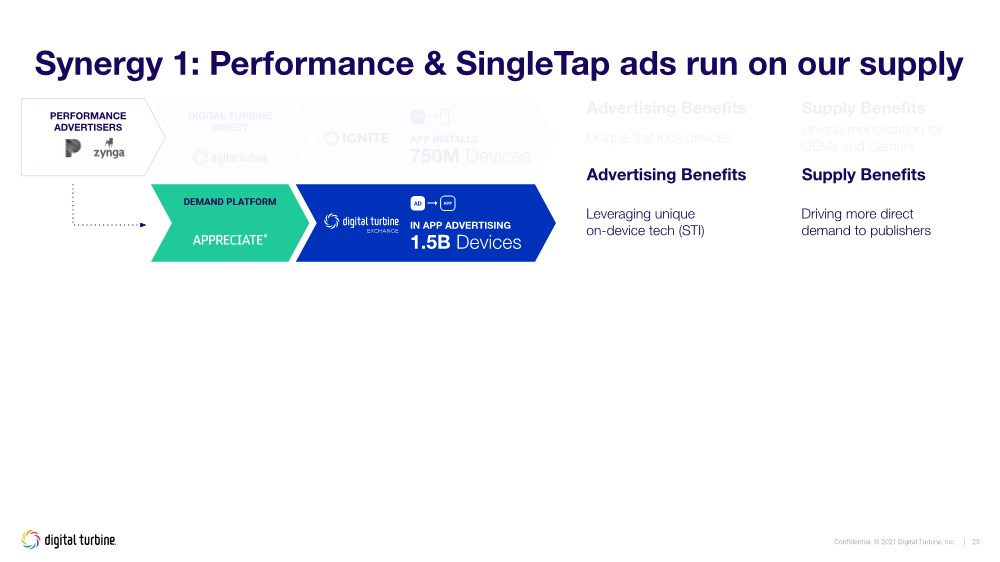
| Confidential. © 2021 Digital Turbine, Inc. | 23 DEMAND PLATFORM Driving more direct demand to publishers Leveraging unique on-device tech (STI) 1.5B Devices IN APP ADVERTISING AD APP Synergy 1: Performance & SingleTap ads run on our supply PERFORMANCE ADVERTISERS Advertising Benefits Supply Benefits DIGITAL TURBINE DIRECT Unique first look devices 750M Devices Unique monetization for OEMs and Carriers APP INSTALLS APP Advertising Benefits Supply Benefits |
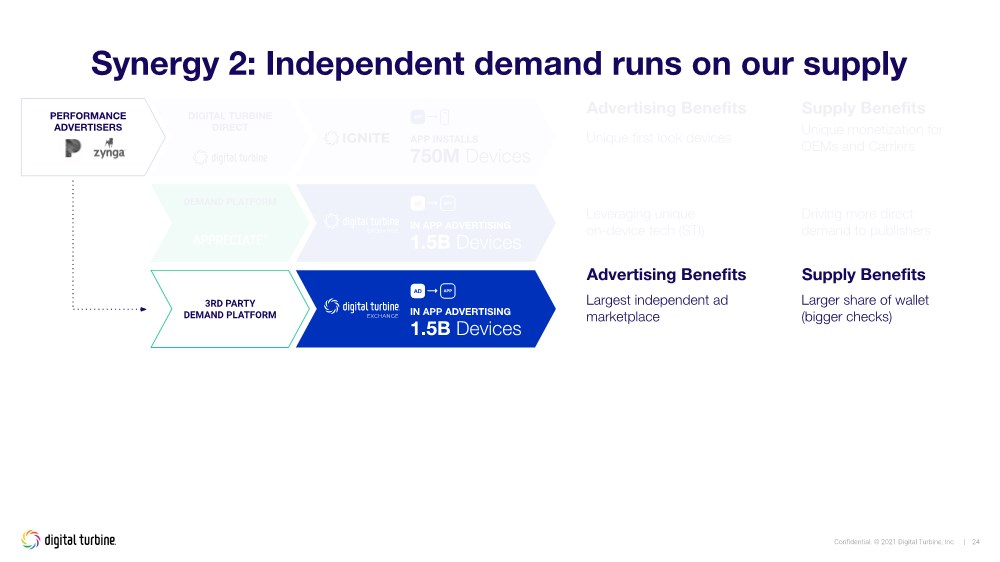
| Confidential. © 2021 Digital Turbine, Inc. | 24 DEMAND PLATFORM Driving more direct demand to publishers Leveraging unique on-device tech (STI) 1.5B Devices IN APP ADVERTISING AD APP Synergy 2: Independent demand runs on our supply 3RD PARTY DEMAND PLATFORM Largest independent ad marketplace Larger share of wallet (bigger checks) 1.5B Devices IN APP ADVERTISING AD APP PERFORMANCE ADVERTISERS Advertising Benefits Supply Benefits DIGITAL TURBINE DIRECT Unique first look devices 750M Devices Unique monetization for OEMs and Carriers APP INSTALLS APP Advertising Benefits Supply Benefits |
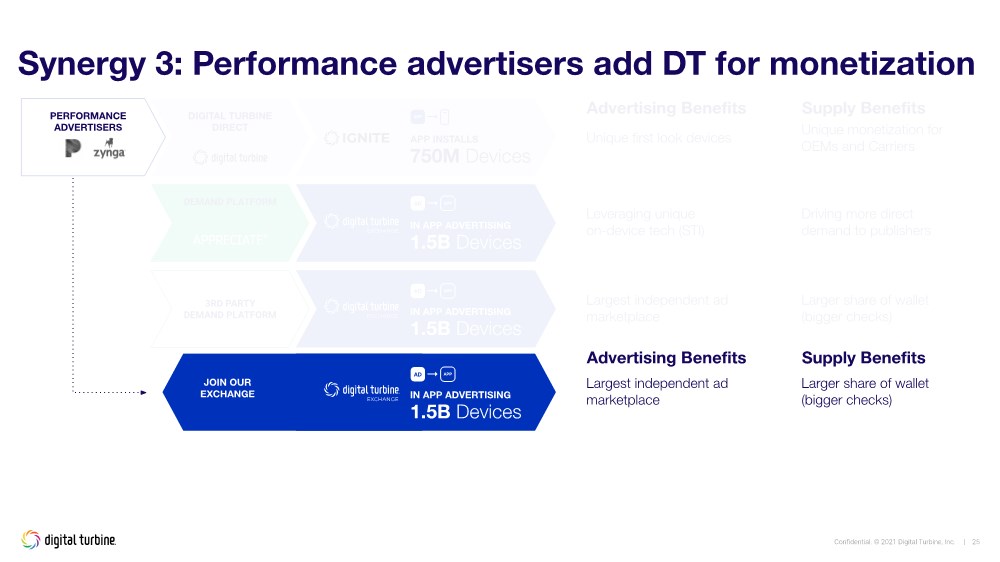
| Confidential. © 2021 Digital Turbine, Inc. | 25 DEMAND PLATFORM Driving more direct demand to publishers Leveraging unique on-device tech (STI) 1.5B Devices IN APP ADVERTISING AD APP Synergy 3: Performance advertisers add DT for monetization 3RD PARTY DEMAND PLATFORM Largest independent ad marketplace Larger share of wallet (bigger checks) 1.5B Devices IN APP ADVERTISING AD APP PERFORMANCE ADVERTISERS Advertising Benefits Supply Benefits DIGITAL TURBINE DIRECT Unique first look devices 750M Devices Unique monetization for OEMs and Carriers APP INSTALLS APP Largest independent ad marketplace Larger share of wallet (bigger checks) JOIN OUR EXCHANGE 1.5B Devices IN APP ADVERTISING AD APP Advertising Benefits Supply Benefits |
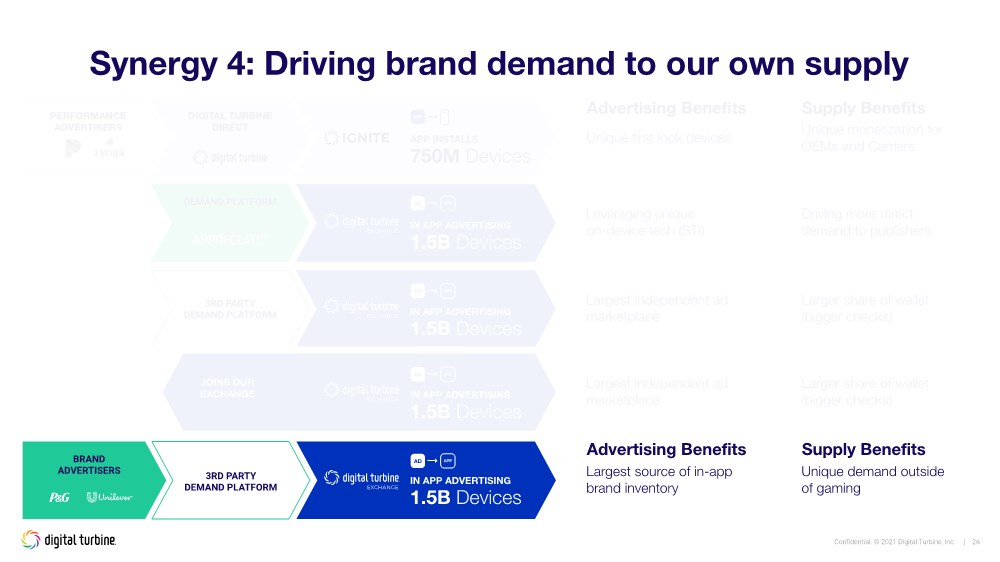
| Confidential. © 2021 Digital Turbine, Inc. | 26 DEMAND PLATFORM Driving more direct demand to publishers Leveraging unique on-device tech (STI) 1.5B Devices IN APP ADVERTISING AD APP 3RD PARTY DEMAND PLATFORM Largest source of in-app brand inventory BRAND ADVERTISERS Unique demand outside of gaming 1.5B Devices IN APP ADVERTISING AD APP Synergy 4: Driving brand demand to our own supply 3RD PARTY DEMAND PLATFORM Largest independent ad marketplace Larger share of wallet (bigger checks) 1.5B Devices IN APP ADVERTISING AD APP PERFORMANCE ADVERTISERS Advertising Benefits Supply Benefits DIGITAL TURBINE DIRECT Unique first look devices 750M Devices Unique monetization for OEMs and Carriers APP INSTALLS APP Largest independent ad marketplace Larger share of wallet (bigger checks) JOINS OUR EXCHANGE 1.5B Devices IN APP ADVERTISING AD APP Advertising Benefits Supply Benefits |
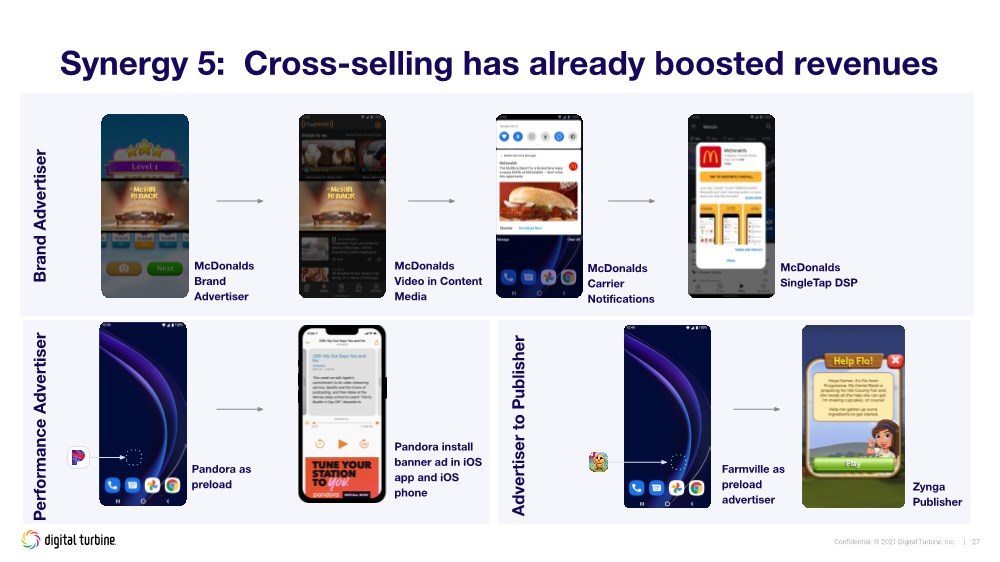
| Confidential. © 2021 Digital Turbine, Inc. | 27 Synergy 5: Cross-selling has already boosted revenues McDonalds Brand Advertiser Brand Advertiser McDonalds Video in Content Media McDonalds Carrier Notifications McDonalds SingleTap DSP Performance Advertiser Pandora as preload Pandora install banner ad in iOS app and iOS phone Advertiser to Publisher Farmville as preload advertiser Zynga Publisher |
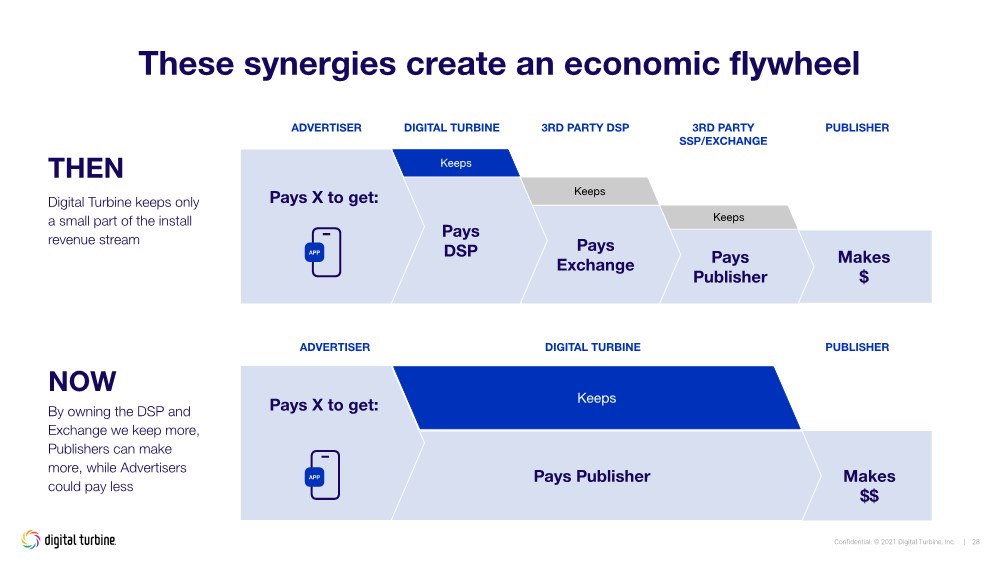
| Confidential. © 2021 Digital Turbine, Inc. | 28 PUBLISHER Makes $$ PUBLISHER Makes $ 3RD PARTY SSP/EXCHANGE Pays Publisher Keeps DIGITAL TURBINE Pays Publisher Keeps NOW By owning the DSP and Exchange we keep more, Publishers can make more, while Advertisers could pay less These synergies create an economic flywheel Digital Turbine keeps only a small part of the install revenue stream THEN 3RD PARTY DSP Pays Exchange Keeps ADVERTISER Pays DSP DIGITAL TURBINE Keeps Pays X to get: APP ADVERTISER Pays X to get: APP |
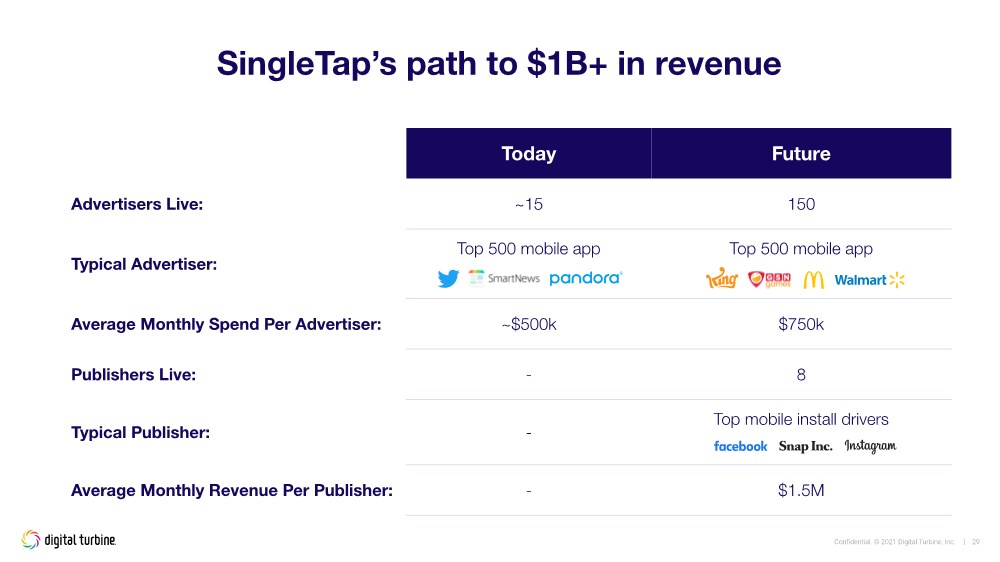
| Confidential. © 2021 Digital Turbine, Inc. | 29 Today Future Advertisers Live: ~15 150 Typical Advertiser: Top 500 mobile app Top 500 mobile app Average Monthly Spend Per Advertiser: ~$500k $750k Publishers Live: - 8 Typical Publisher: - Top mobile install drivers Average Monthly Revenue Per Publisher: - $1.5M SingleTap’s path to $1B+ in revenue |
| Confidential. © 2021 Digital Turbine, Inc. | 30 ● On-Device Software ● End-to-End Ad Stack ● Independence ● Holistic View of the User ● Brand Advertising WHY WE WIN |
| Q & A Part 1 |

| Financial Outlook Barrett Garrison |

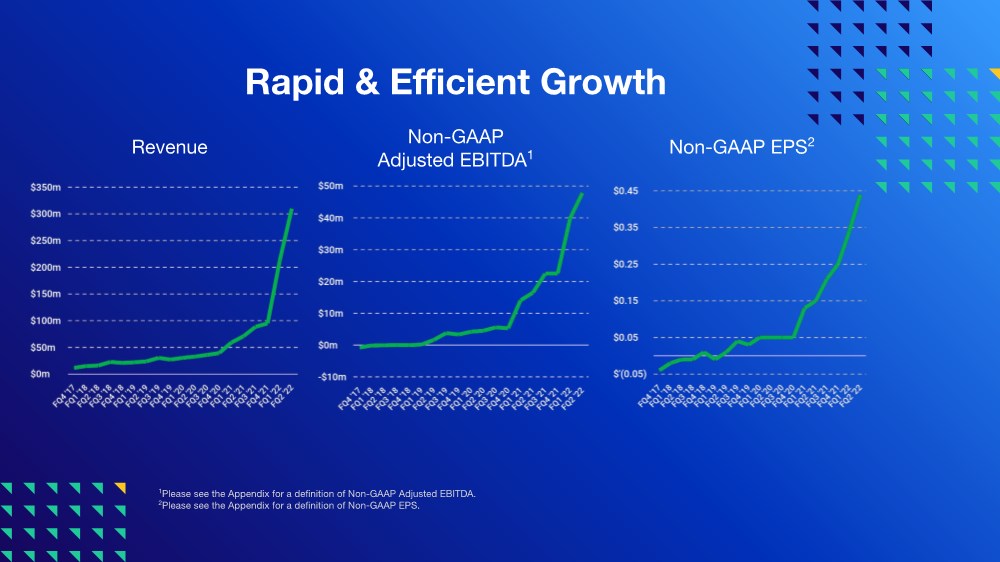
| Rapid & Efficient Growth Revenue Non-GAAP Adjusted EBITDA1 Non-GAAP EPS2 1Please see the Appendix for a definition of Non-GAAP Adjusted EBITDA. 2Please see the Appendix for a definition of Non-GAAP EPS. |
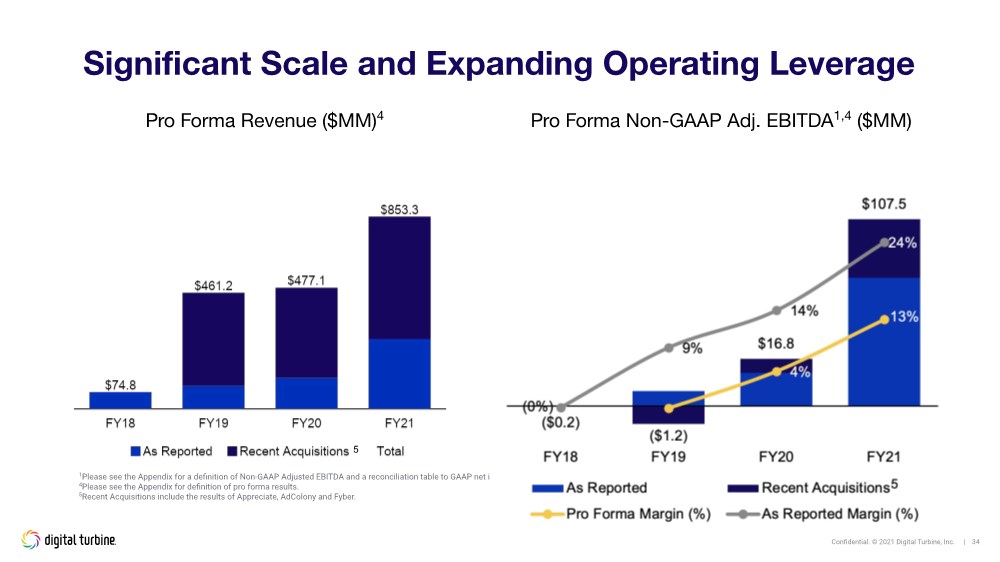
| Confidential. © 2021 Digital Turbine, Inc. | 34 Significant Scale and Expanding Operating Leverage 1Please see the Appendix for a definition of Non-GAAP Adjusted EBITDA and a reconciliation table to GAAP net income. 4Please see the Appendix for definition of pro forma results. 5Recent Acquisitions include the results of Appreciate, AdColony and Fyber. Pro Forma Revenue ($MM)4 Pro Forma Non-GAAP Adj. EBITDA1,4 ($MM) 5 |
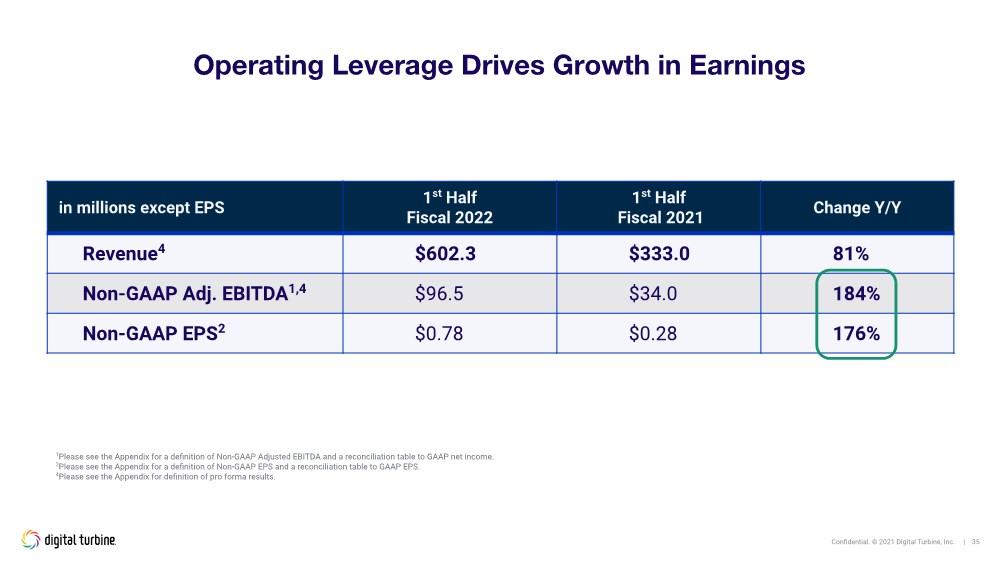
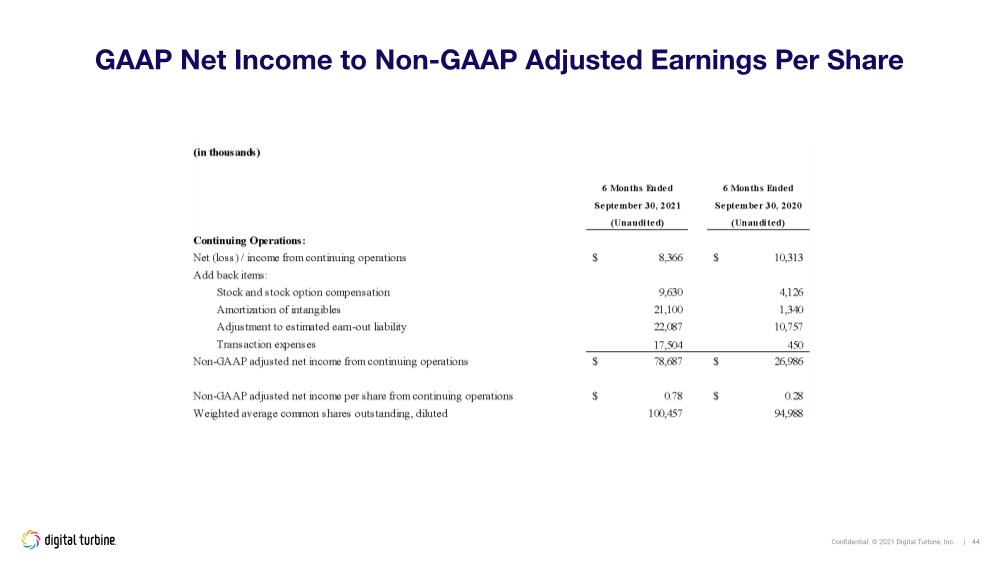
| Confidential. © 2021 Digital Turbine, Inc. | 35 Operating Leverage Drives Growth in Earnings in millions except EPS 1st Half Fiscal 2022 1st Half Fiscal 2021 Change Y/Y Revenue4 $602.3 $333.0 81% Non-GAAP Adj. EBITDA1,4 $96.5 $34.0 184% Non-GAAP EPS2 $0.78 $0.28 176% 1Please see the Appendix for a definition of Non-GAAP Adjusted EBITDA and a reconciliation table to GAAP net income. 2Please see the Appendix for a definition of Non-GAAP EPS and a reconciliation table to GAAP EPS. 4Please see the Appendix for definition of pro forma results. |
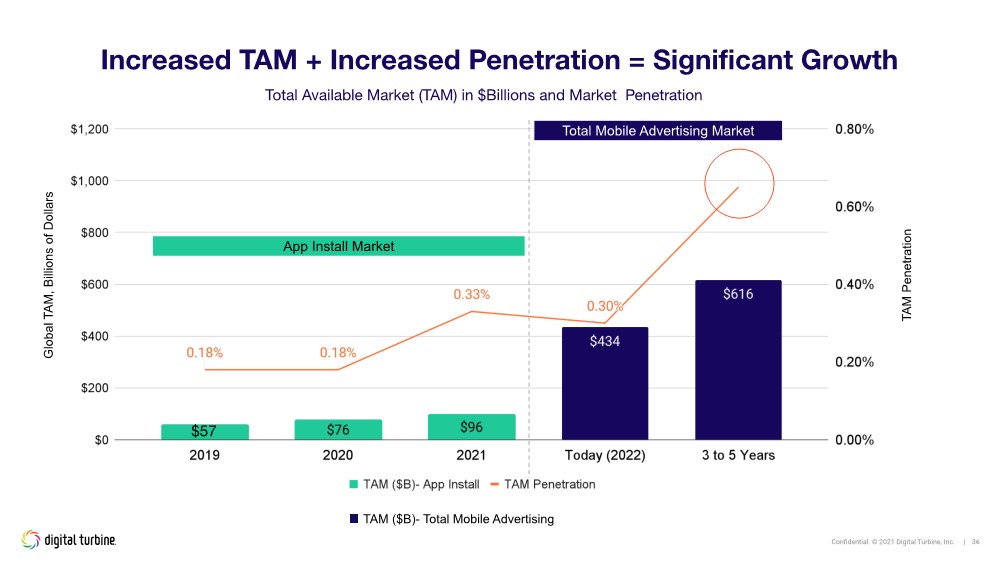
| Confidential. © 2021 Digital Turbine, Inc. | 36 Increased TAM + Increased Penetration = Significant Growth App Install Market $57 TAM ($B)- Total Mobile Advertising Total Available Market (TAM) in $Billions and Market Penetration Global TAM, Billions of Dollars Total Mobile Advertising Market TAM Penetration |
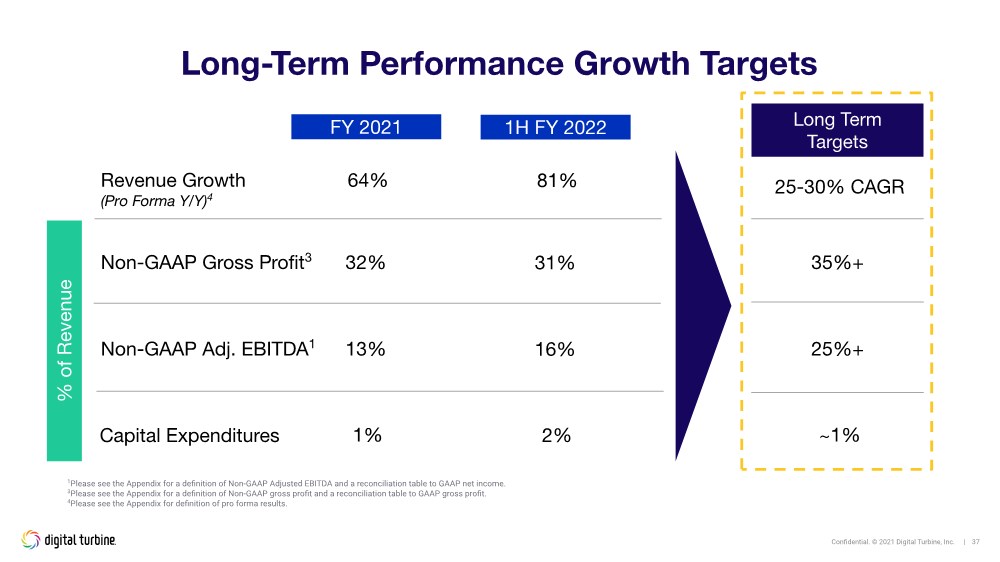
| Confidential. © 2021 Digital Turbine, Inc. | 37 Long-Term Performance Growth Targets Revenue Growth (Pro Forma Y/Y)4 Non-GAAP Gross Profit3 Non-GAAP Adj. EBITDA1 FY 2021 64% 32% 13% Long Term Targets 25-30% CAGR 35%+ 25%+ 1Please see the Appendix for a definition of Non-GAAP Adjusted EBITDA and a reconciliation table to GAAP net income. 3Please see the Appendix for a definition of Non-GAAP gross profit and a reconciliation table to GAAP gross profit. 4Please see the Appendix for definition of pro forma results. Capital Expenditures 1% ~1% % of Revenue 1H FY 2022 81% 31% 16% 2% |
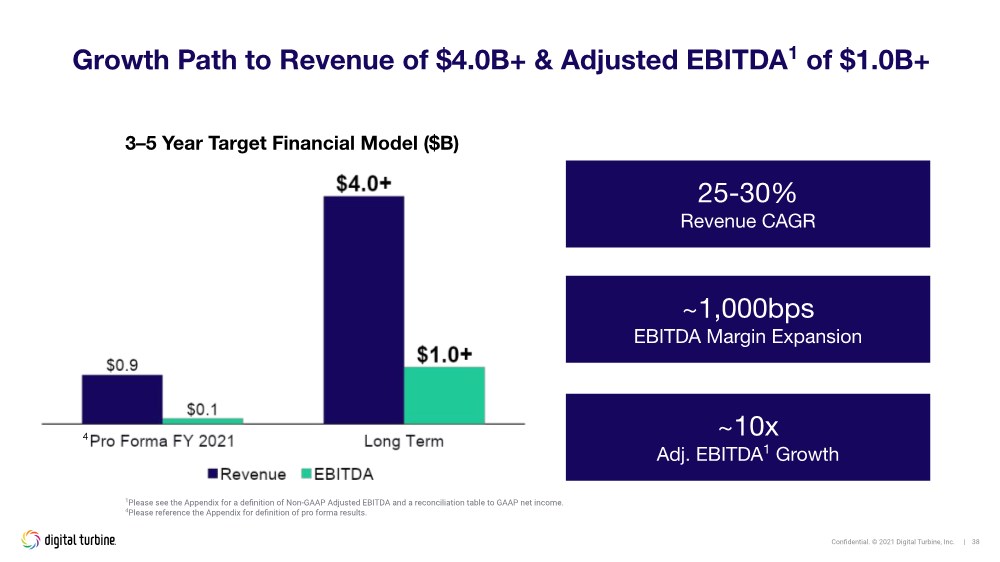
| Confidential. © 2021 Digital Turbine, Inc. | 38 Growth Path to Revenue of $4.0B+ & Adjusted EBITDA1 of $1.0B+ 1Please see the Appendix for a definition of Non-GAAP Adjusted EBITDA and a reconciliation table to GAAP net income. 4Please reference the Appendix for definition of pro forma results. 3–5 Year Target Financial Model ($B) 25-30% Revenue CAGR ~1,000bps EBITDA Margin Expansion ~10x Adj. EBITDA1 Growth 4 |
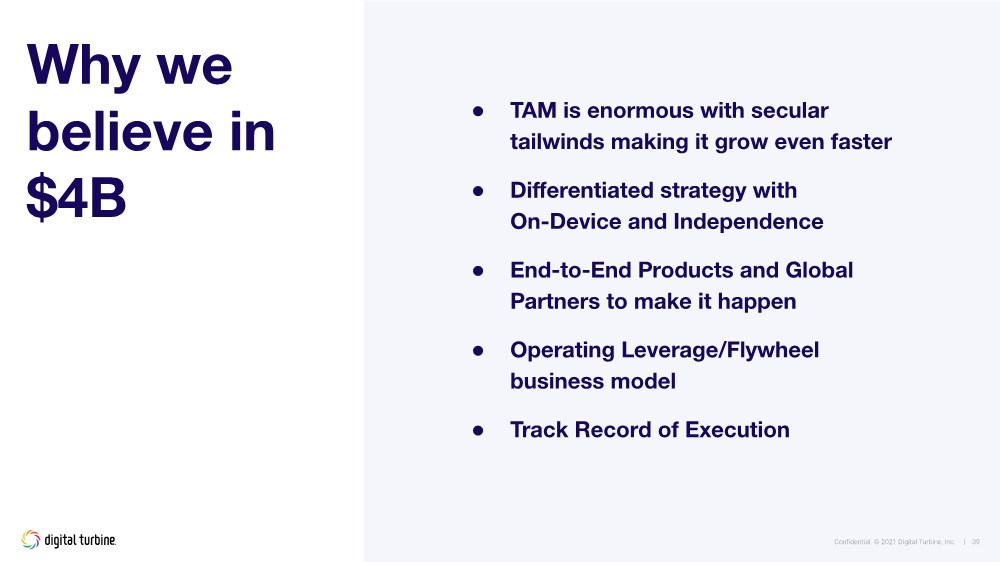
| Confidential. © 2021 Digital Turbine, Inc. | 39 ● TAM is enormous with secular tailwinds making it grow even faster ● Differentiated strategy with On-Device and Independence ● End-to-End Products and Global Partners to make it happen ● Operating Leverage/Flywheel business model ● Track Record of Execution Why we believe in $4B |
| Q & A Part 2 |

| Appendix |

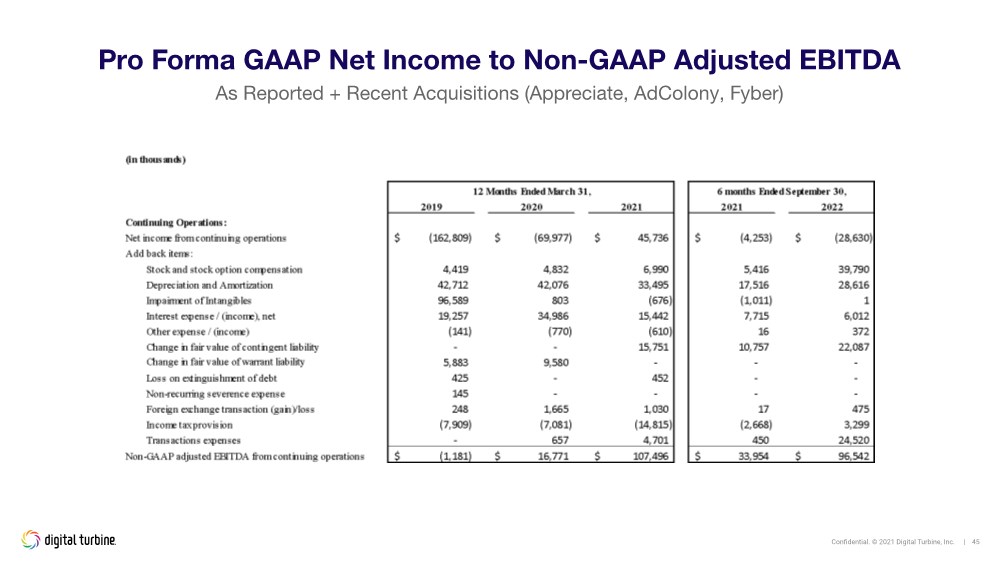
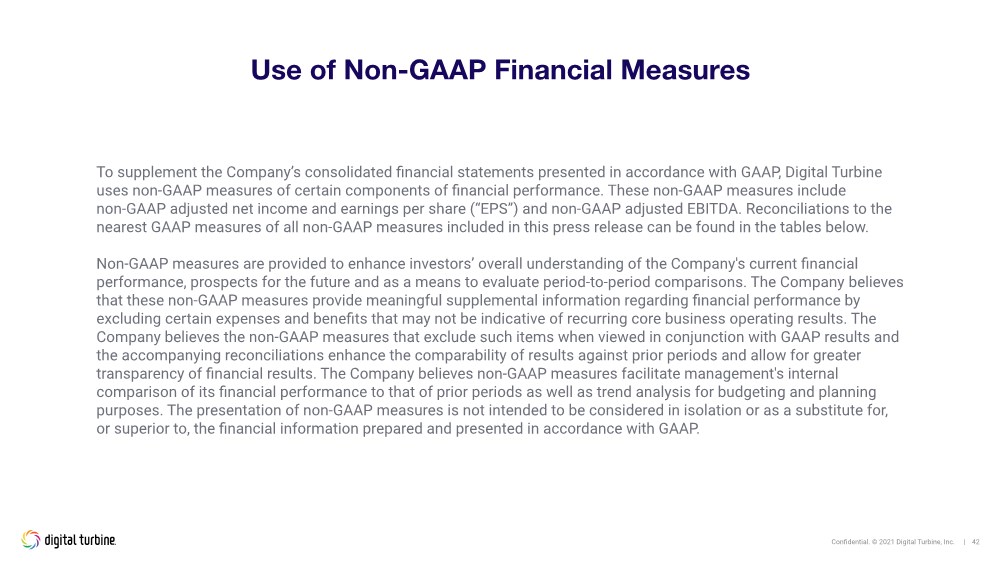
| Confidential. © 2021 Digital Turbine, Inc. | 42 Use of Non-GAAP Financial Measures To supplement the Company’s consolidated financial statements presented in accordance with GAAP, Digital Turbine uses non-GAAP measures of certain components of financial performance. These non-GAAP measures include non-GAAP adjusted net income and earnings per share (“EPS”) and non-GAAP adjusted EBITDA. Reconciliations to the nearest GAAP measures of all non-GAAP measures included in this press release can be found in the tables below. Non-GAAP measures are provided to enhance investors’ overall understanding of the Company's current financial performance, prospects for the future and as a means to evaluate period-to-period comparisons. The Company believes that these non-GAAP measures provide meaningful supplemental information regarding financial performance by excluding certain expenses and benefits that may not be indicative of recurring core business operating results. The Company believes the non-GAAP measures that exclude such items when viewed in conjunction with GAAP results and the accompanying reconciliations enhance the comparability of results against prior periods and allow for greater transparency of financial results. The Company believes non-GAAP measures facilitate management's internal comparison of its financial performance to that of prior periods as well as trend analysis for budgeting and planning purposes. The presentation of non-GAAP measures is not intended to be considered in isolation or as a substitute for, or superior to, the financial information prepared and presented in accordance with GAAP. |
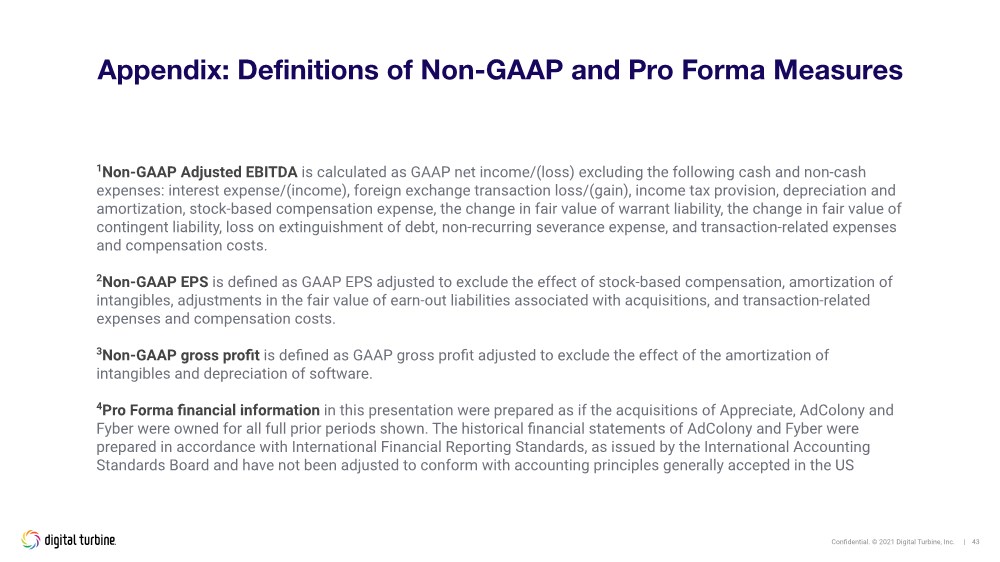
| Confidential. © 2021 Digital Turbine, Inc. | 43 Appendix: Definitions of Non-GAAP and Pro Forma Measures 1Non-GAAP Adjusted EBITDA is calculated as GAAP net income/(loss) excluding the following cash and non-cash expenses: interest expense/(income), foreign exchange transaction loss/(gain), income tax provision, depreciation and amortization, stock-based compensation expense, the change in fair value of warrant liability, the change in fair value of contingent liability, loss on extinguishment of debt, non-recurring severance expense, and transaction-related expenses and compensation costs. 2Non-GAAP EPS is defined as GAAP EPS adjusted to exclude the effect of stock-based compensation, amortization of intangibles, adjustments in the fair value of earn-out liabilities associated with acquisitions, and transaction-related expenses and compensation costs. 3Non-GAAP gross profit is defined as GAAP gross profit adjusted to exclude the effect of the amortization of intangibles and depreciation of software. 4Pro Forma financial information in this presentation were prepared as if the acquisitions of Appreciate, AdColony and Fyber were owned for all full prior periods shown. The historical financial statements of AdColony and Fyber were prepared in accordance with International Financial Reporting Standards, as issued by the International Accounting Standards Board and have not been adjusted to conform with accounting principles generally accepted in the US |
| Confidential. © 2021 Digital Turbine, Inc. | 44 GAAP Net Income to Non-GAAP Adjusted Earnings Per Share |
| Confidential. © 2021 Digital Turbine, Inc. | 45 Pro Forma GAAP Net Income to Non-GAAP Adjusted EBITDA As Reported + Recent Acquisitions (Appreciate, AdColony, Fyber) |