Mandalay Digital Group, Inc. Investor Day Presentation July 9, 2014
Safe Harbor Statements. Statements in this presentation concerning future results from operations, financial position, economic conditions, product releases and any other statement that may be construed as a prediction of future performance or events, including without limitation statements regarding future profitability and expected 2015 revenues, carrier (including Tier 1 carrier) relationships and product deployment and ramp up are “forward - looking statements” (within the meaning of Section 27A of the Securities Act of 1933, as amended, and Section 21E of the Securities Exchange Act of 1934, as amended), which involve known and unknown risks, uncertainties and other factors which may cause actual results to differ materially from those expressed or implied by such statements. We claim the protection of the safe harbor contained in the Private Securities Litigation Reform Act of 1995 related to these forward looking statements. These factors include the inherent challenges in converting discussions with carriers into contractual relationships and deploying our key products within large enterprises such as major carriers in a timely manner, product acceptance of new products in a competitive marketplace,
the potential for unforeseen or underestimated cash requirements or liabilities, the impact of currency exchange rate fluctuations on our reported GAAP financial statements, the Company’s ability as a smaller company to manage international operations, its ability given the Company’s limited resources to identify and consummate acquisitions, varying and often unpredictable levels of orders, the challenges inherent in technology development necessary to maintain the Company’s competitive advantage such as adherence to release schedules and the costs and time required for finalization and gaining market acceptance of new products, changes in economic conditions and market demand, rapid and complex changes occurring in the mobile marketplace, pricing and other activities by competitors, and other risks including those described from time to time in Mandalay Digital Group's filings on Forms 10 - K and 10 - Q with the Securities and Exchange Commission (SEC), press releases and other communications. We disclaim any intention or obligation to update or revise any forward - looking statements, whether as a result of new information, future events or otherwise, except as may be required by law. Use of Non - GAAP Financial Measures. Adjusted EBITDA is calculated as income (loss) from continuing operations before interest expense, foreign exchange gains (losses), financing and related expenses, debt discount and debt settlement expense, gain or loss on extinguishment of debt, acquisition and integration costs, income taxes, asset impairment charges, depreciation and amortization, stock - based compensation expense, change in fair value of derivatives, and accruals for discretionary bonuses. Since Adjusted EBITDA is a non - GAAP measure that does not have a standardized meaning, it may not be comparable to similar measures presented by other companies. Readers are cautioned that Adjusted EBITDA should not be construed as an alternative to net income (loss) determined in accordance with U.S. GAAP as an indicator of performance, which is the most comparable measure under GAAP. Adjusted EBITDA is used by management as an internal measure of profitability. We have included Adjusted EBITDA because we believe that this measure is used by certain investors to assess our financial performance before non - cash charges and certain costs that we do not believe are reflective of our underlying business. A reconciliation of Adjusted EBITDA to U.S. GAAP net income is expected to be included in the press release announcing the results of our second fiscal quarter, however such reconciliation to future net income is not currently available without unreasonable effort. The information that is unavailable is primarily asset impairment and expenses related to stock - based compensation; it is probable that when such amounts are available they will result in a significant GAAP net loss for our second fiscal quarter notwithstanding our expected Adjusted EBITDA results. MANDALAY DIGITAL GROUP, INC. INVESTOR DAY PRESENTATION © 2014 Mandalay Digital Group, Inc. Page 2
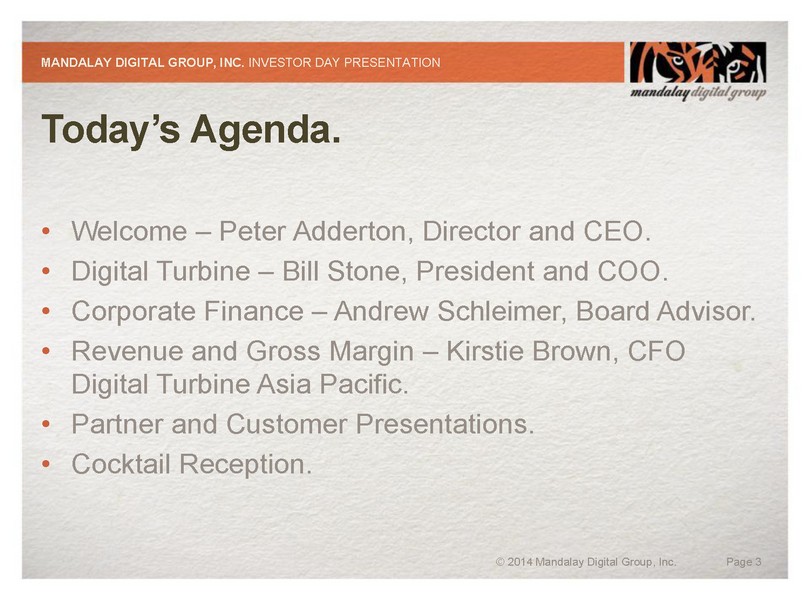
Today’s Agenda. • Welcome – Peter Adderton, Director and CEO. • Digital Turbine – Bill Stone, President and COO. • Corporate Finance – Andrew Schleimer, Board Advisor. • Revenue and Gross Margin – Kirstie Brown, CFO Digital Turbine Asia Pacific. • Partner and Customer Presentations. • Cocktail Reception. MANDALAY DIGITAL GROUP, INC. INVESTOR DAY PRESENTATION © 2014 Mandalay Digital Group, Inc.
Page 3
I
ntroduction and Welcome Peter Adderton – Director and CEO
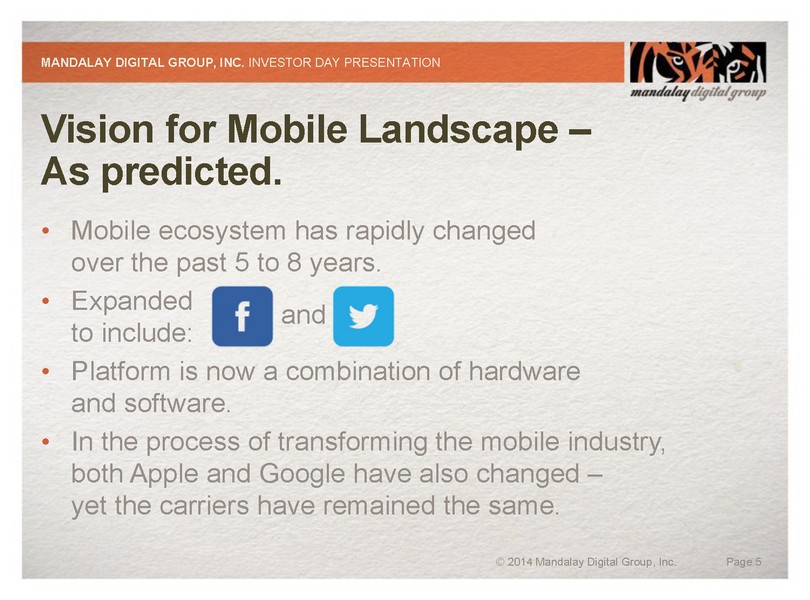
V
ision for Mobile Landscape – As predicted. • Mobile ecosystem has rapidly changed over the past 5 to 8 years. • Expanded to include: • Platform is now a combination of hardware and software. • In the process of transforming the mobile industry, both Apple and Google have also changed – yet the carriers have remained the same. MANDALAY DIGITAL GROUP, INC. INVESTOR DAY PRESENTATION © 2014 Mandalay Digital Group, Inc. Page 5 and
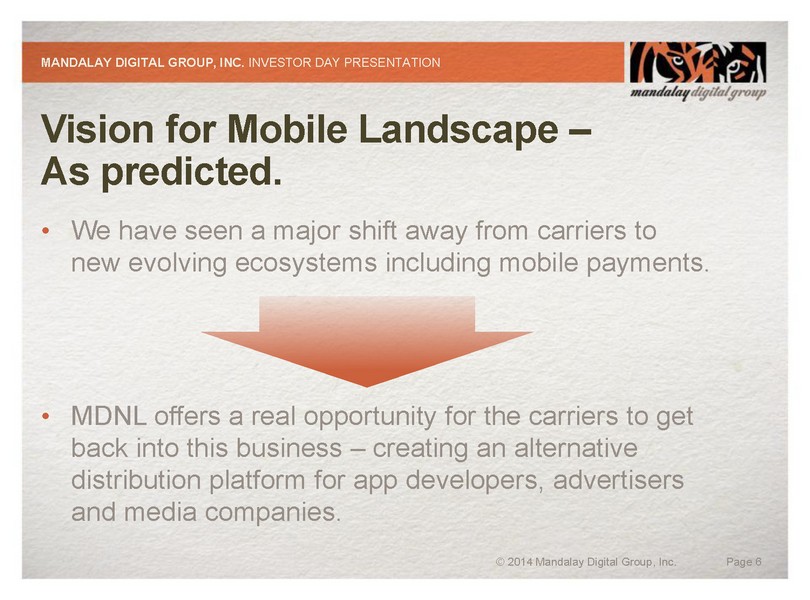
V
ision for Mobile Landscape – As predicted. • We have seen a major shift away from carriers to new evolving ecosystems including mobile payments. • MDNL offers a real opportunity for the carriers to get back into this business – creating an alternative distribution platform for app developers, advertisers and media companies. MANDALAY DIGITAL GROUP, INC. INVESTOR DAY PRESENTATION © 2014 Mandalay Digital Group, Inc. Page 6

A
productive ‘ First 30 Months .’ • Contributed Digital Turbine for 100% equity into Mandalay Digital Group. • Combination of Technology (Adderton) with Content ( Guber) – a marriage of strengths. • Completed multiple acquisitions to build pipe to distribute products and services. MANDALAY DIGITAL GROUP, INC. INVESTOR DAY PRESENTATION © 2014 Mandalay Digital Group, Inc. Page 7
A
productive ‘ First 30 Months .’ • Strengthened Board of Directors and Management Team. • Up - listed to Nasdaq from OTC Pink Sheets. • Cleaned up balance sheet and diversified shareholder base. • Well - positioned to grow and scale. MANDALAY DIGITAL GROUP, INC. INVESTOR DAY PRESENTATION © 2014 Mandalay Digital Group, Inc. Page 8
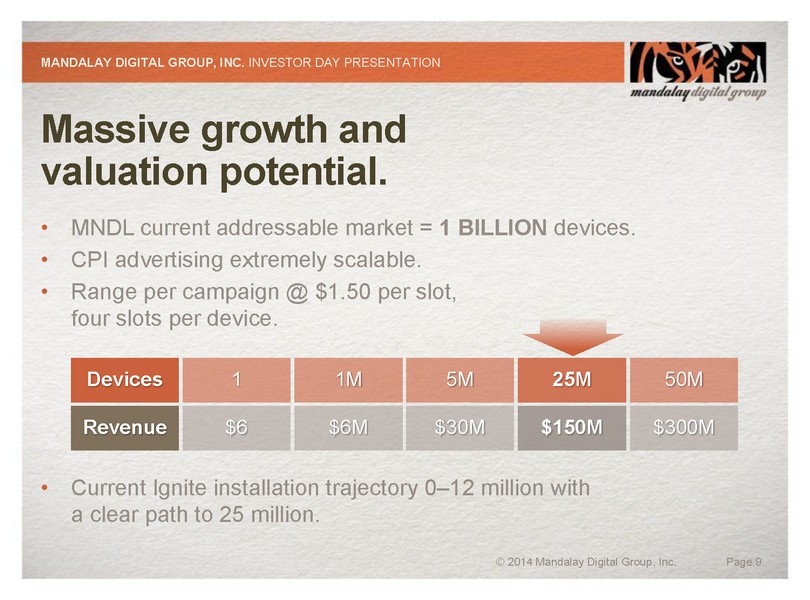
Massive growth and valuation potential. • MNDL current addressable market = 1 BILLION devices. • CPI advertising extremely scalable. • Range per campaign @ $1.50 per slot, four slots per device. • Current Ignite installation trajectory 0 – 12 million with a clear path to 25 million. MANDALAY DIGITAL GROUP, INC. INVESTOR DAY PRESENTATION © 2014 Mandalay Digital Group, Inc. Page 9 Devices 1 1M
5M 25M 50M Revenue $6 $6M $30M $150M $300M
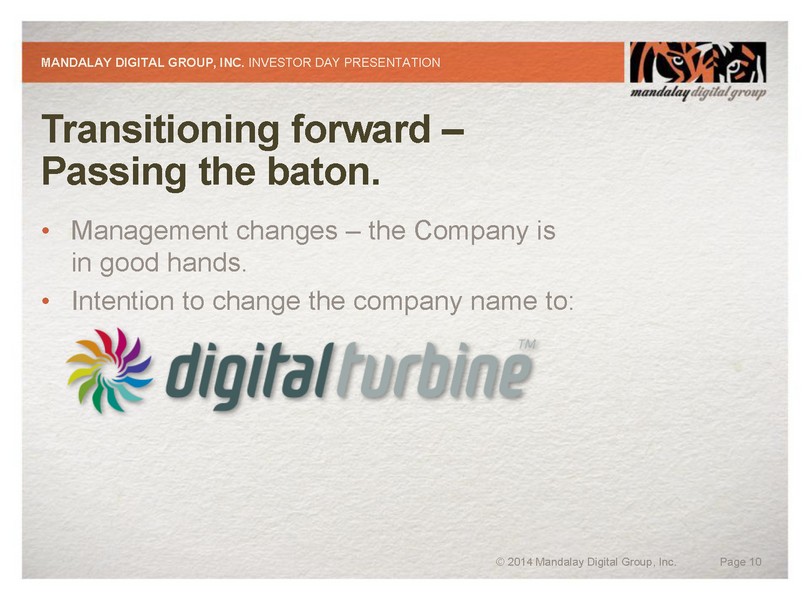
Transitioning forward – Passing the baton. • Management changes – the Company is in good hands. • Intention to change the company name to: MANDALAY DIGITAL GROUP, INC. INVESTOR DAY PRESENTATION © 2014 Mandalay Digital Group, Inc. Page 10
Digital Turbine Bill Stone – President and COO
Topics. • The Big Picture. • Connecting Digital Turbine to the Big Picture. • Digital Turbine Updates: – Products. – Customers and Case Studies. – Metrics. • Q and A. MANDALAY DIGITAL GROUP, INC. INVESTOR DAY PRESENTATION © 2014 Mandalay Digital Group, Inc. Page 12
The Big Picture. • Smartphones. • Operating Systems. • Mobile Content. • Mobile Advertising and Applications. • Operators versus Over - the - top (OTT ). MANDALAY DIGITAL GROUP, INC. INVESTOR DAY PRESENTATION © 2014 Mandalay Digital Group, Inc. Page 13
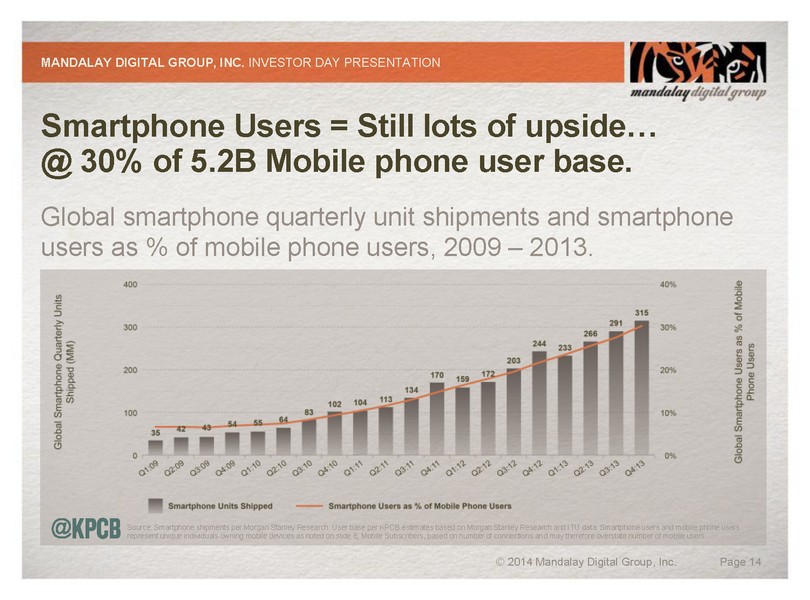
Smartphone Users = Still lots of upside… @ 30% of 5.2B Mobile phone user base. Global smartphone quarterly unit shipments and smartphone users as % of mobile phone users, 2009 – 2013. MANDALAY DIGITAL GROUP, INC. INVESTOR DAY PRESENTATION © 2014 Mandalay Digital Group, Inc. Page 14 Source: Smartphone shipments per Morgan Stanley Research. User base per KPCB estimates based on Morgan Stanley Research and I TU data. Smartphone users and mobile phone users represent unique individuals owning mobile devices as noted on slide 8; Mobile Subscribers, based on number of connections an d m ay therefore overstate number of mobile users.
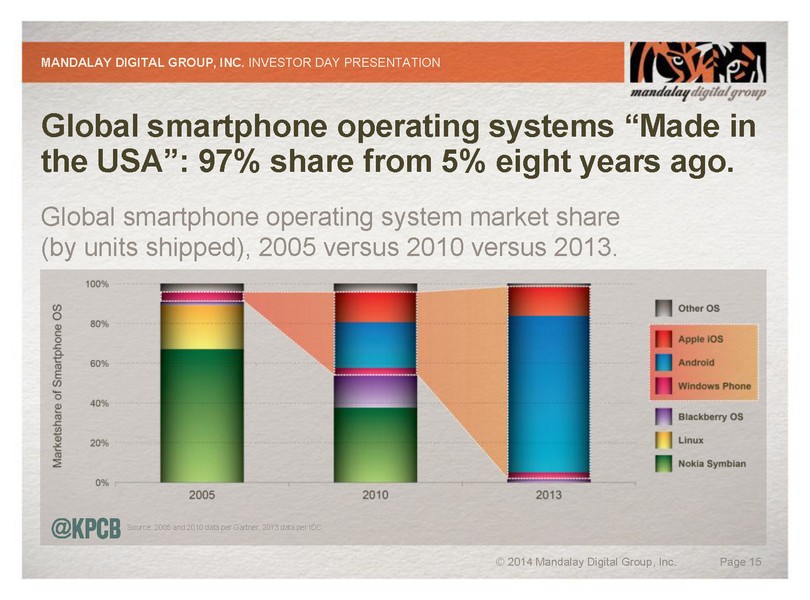
Global smartphone operating systems “Made in the USA”: 97% share from 5% eight years ago. Global smartphone operating system market share (by units shipped), 2005 versus 2010 versus 2013. MANDALAY DIGITAL GROUP, INC. INVESTOR DAY PRESENTATION © 2014 Mandalay Digital Group, Inc. Page 15 Source: 2005 and 2010 data per Gartner, 2013 data per IDC.
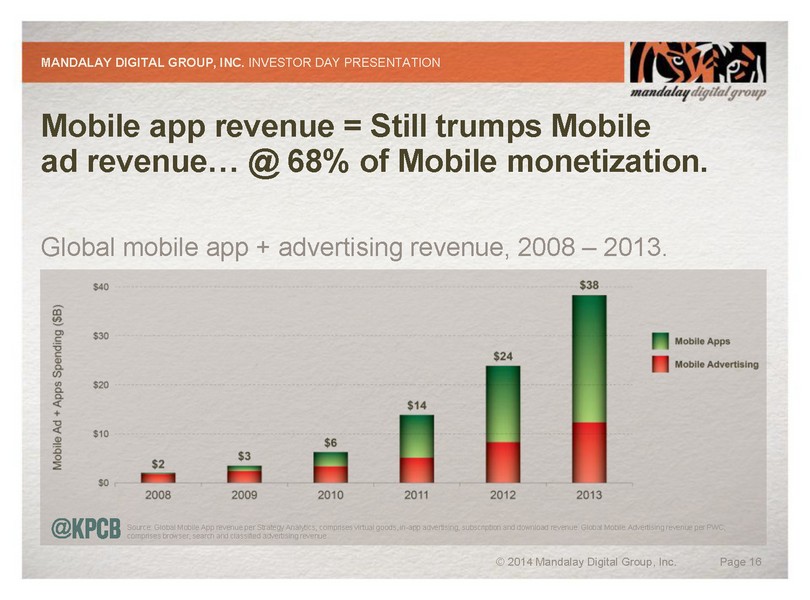
Mobile app revenue = Still trumps Mobile ad revenue… @ 68% of Mobile monetization. Global mobile app + advertising revenue, 2008 – 2013. MANDALAY DIGITAL GROUP, INC. INVESTOR DAY PRESENTATION © 2014 Mandalay Digital Group, Inc. Page 16 Source: Global Mobile App revenue per Strategy Analytics; comprises virtual goods, in - app advertising, subscription and download revenue. Global Mobile A dvertising revenue per PWC; comprises browser, search and classified advertising revenue.
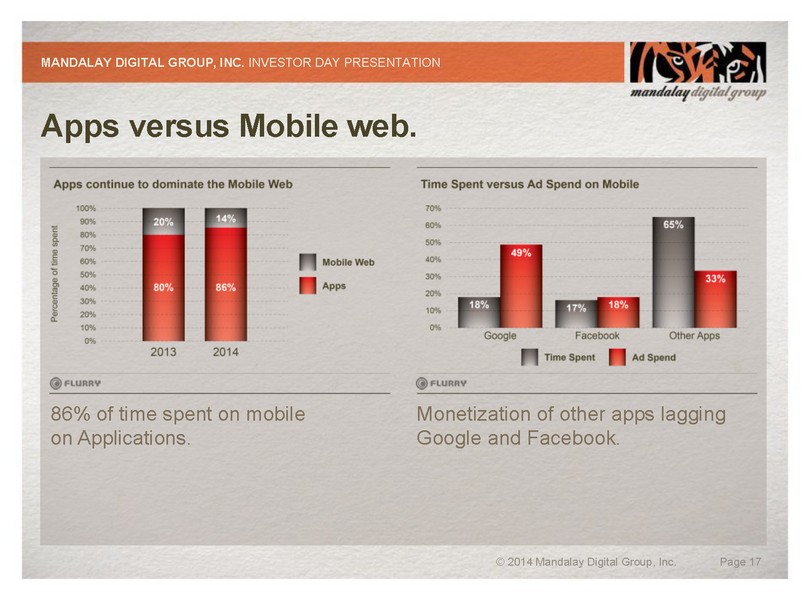
Apps versus Mobile web. MANDALAY DIGITAL GROUP, INC. INVESTOR DAY PRESENTATION © 2014 Mandalay Digital Group, Inc. Page 17 86% of time spent on mobile on Applications. Monetization of other apps lagging Google and Facebook.
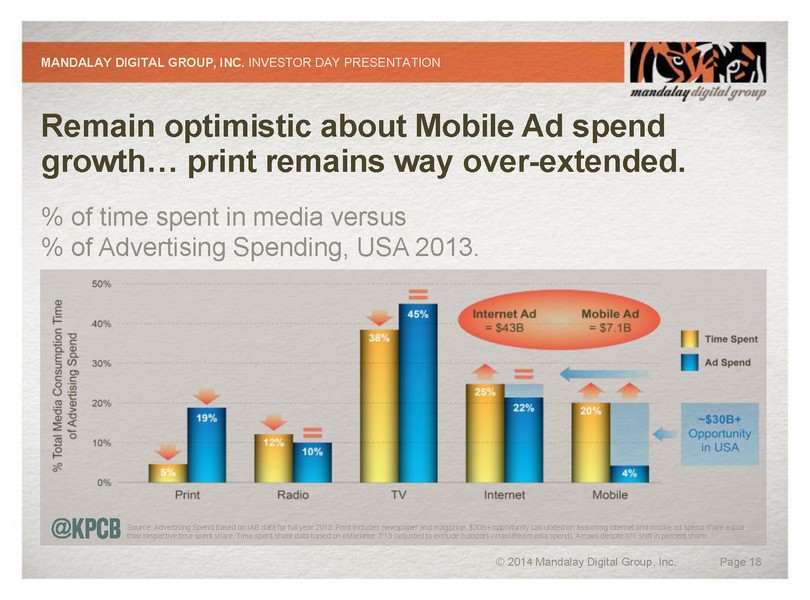
Remain optimistic about Mobile Ad spend growth… print remains way over - extended. % of time spent in media versus % of Advertising Spending, USA 2013. MANDALAY DIGITAL GROUP, INC. INVESTOR DAY PRESENTATION © 2014 Mandalay Digital Group, Inc. Page 18 Source: Advertising Spend based on IAB data for full year 2013. Print includes newspaper and magazine. $30B+ opportunity calc ula ted on assuming internet and mobile ad spend share equal their respective time spent share. Time spent share data based on eMarketer 7/13 (adjusted to exclude outdoors / classified m edi a spend). Arrows denote Y/Y shift in percent share.
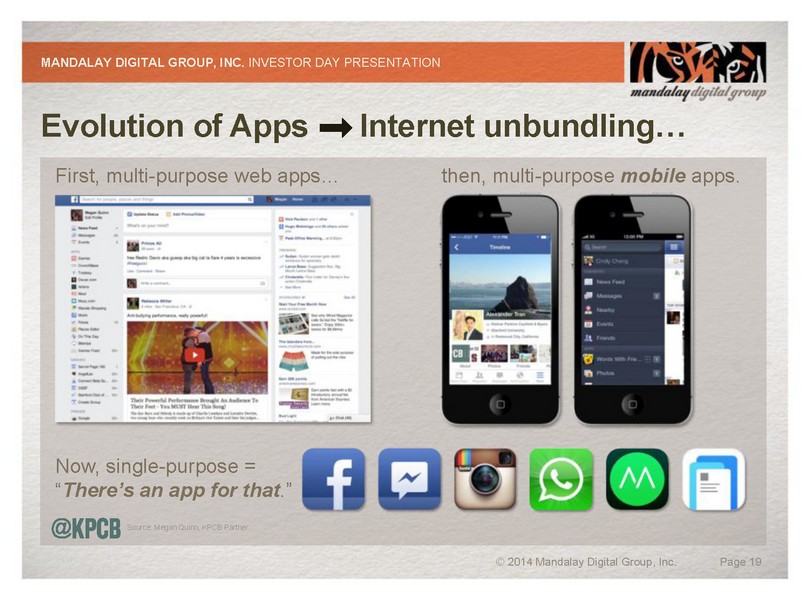
Evolution of Apps Internet unbundling… First, multi - purpose web apps… MANDALAY DIGITAL GROUP, INC. INVESTOR DAY PRESENTATION © 2014 Mandalay Digital Group, Inc. Page 19 Source: Megan Quinn, KPCB Partner. then, multi - purpose mobile apps. Now, single - purpose = “ There’s an app for that .”
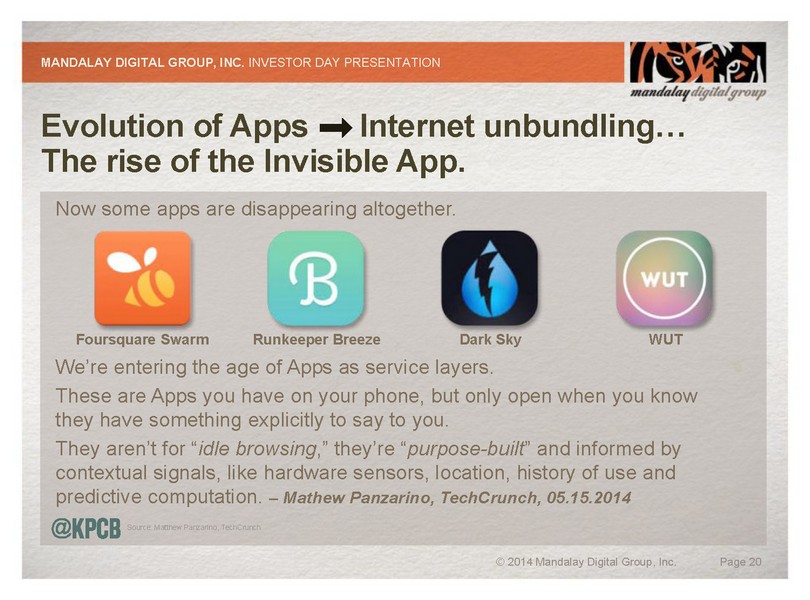
Evolution of Apps Internet unbundling… The rise of the Invisible App. Now some apps are disappearing altogether. MANDALAY DIGITAL GROUP, INC. INVESTOR DAY PRESENTATION © 2014 Mandalay Digital Group, Inc. Page 20 Source: Matthew Panzarino, TechCrunch. We’re entering the age of Apps as service layers. These are Apps you have on your phone, but only open when you know they have something explicitly to say to you. They aren’t for “ idle browsing ,” they’re “ purpose - built ” and informed by contextual signals, like hardware sensors, location, history of use and predictive computation. – Mathew Panzarino, TechCrunch, 05.15.2014 Foursquare Swarm Runkeeper Breeze Dark Sky WUT
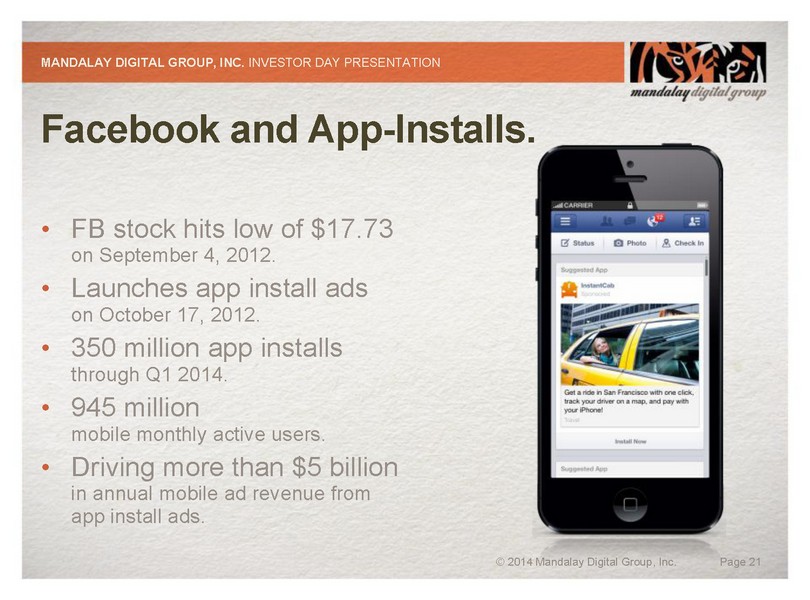
Facebook and App - Installs. • FB stock hits low of $17.73 on September 4, 2012. • Launches app install ads on October 17, 2012. • 350 million app installs through Q1 2014. • 945 million mobile monthly active users. • Driving more than $5 billion in annual mobile ad revenue from app install ads. MANDALAY DIGITAL GROUP, INC. INVESTOR DAY PRESENTATION © 2014 Mandalay Digital Group, Inc. Page 21
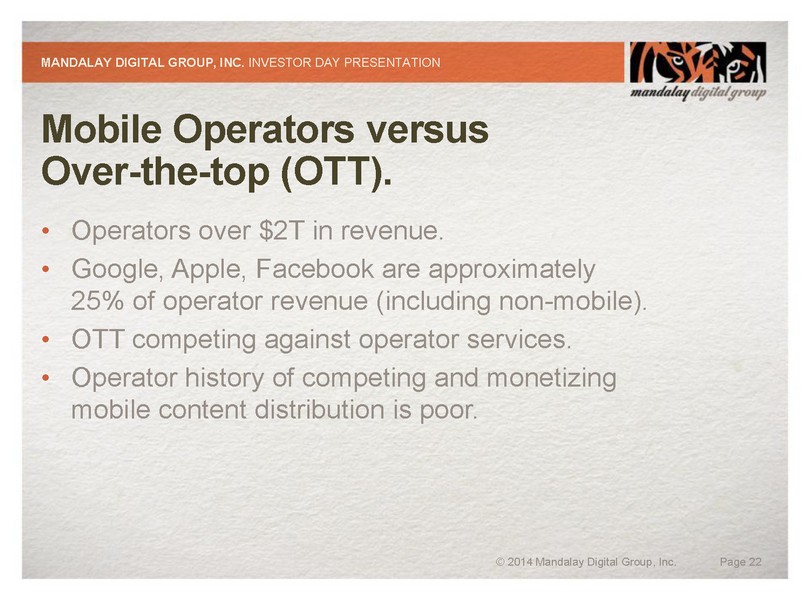
M
obile Operators versus Over - the - top (OTT ). • Operators over $2T in revenue. • Google, Apple, Facebook are approximately 25 % of operator revenue (including non - mobile ). • OTT competing against operator services. • Operator history of competing and monetizing mobile content distribution is poor. MANDALAY DIGITAL GROUP, INC. INVESTOR DAY PRESENTATION © 2014 Mandalay Digital Group, Inc. Page 22
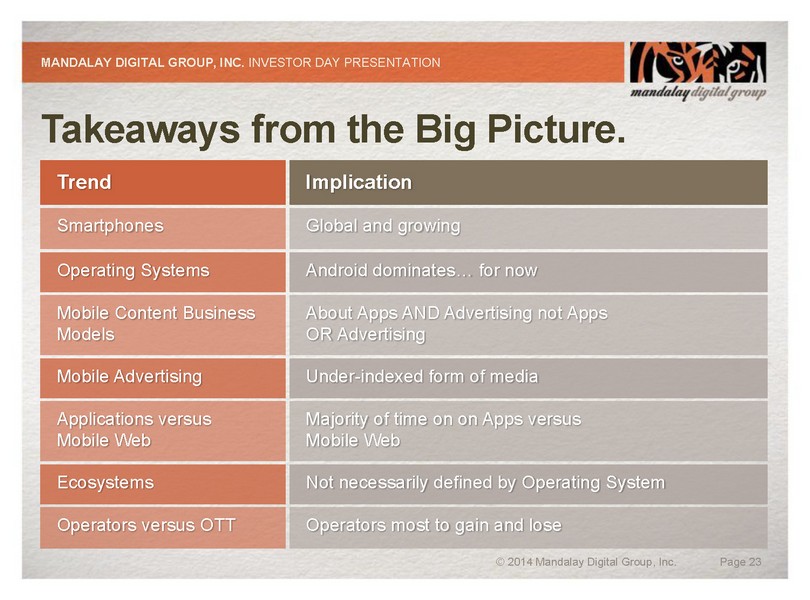
Takeaways from the Big Picture. MANDALAY DIGITAL GROUP, INC. INVESTOR DAY PRESENTATION © 2014 Mandalay Digital Group, Inc. Page 23 Trend Implication Smartphones Global and g rowing Operating Systems Android dominates … for now Mobile Content Business Models About Apps AND Advertising not Apps OR Advertising Mobile Advertising Under - indexed form of media Applications versus Mobile Web Majority of time on on Apps versus Mobile Web Ecosystems Not necessarily defined by Operating System Operators versus OTT Operators most to gain and lose
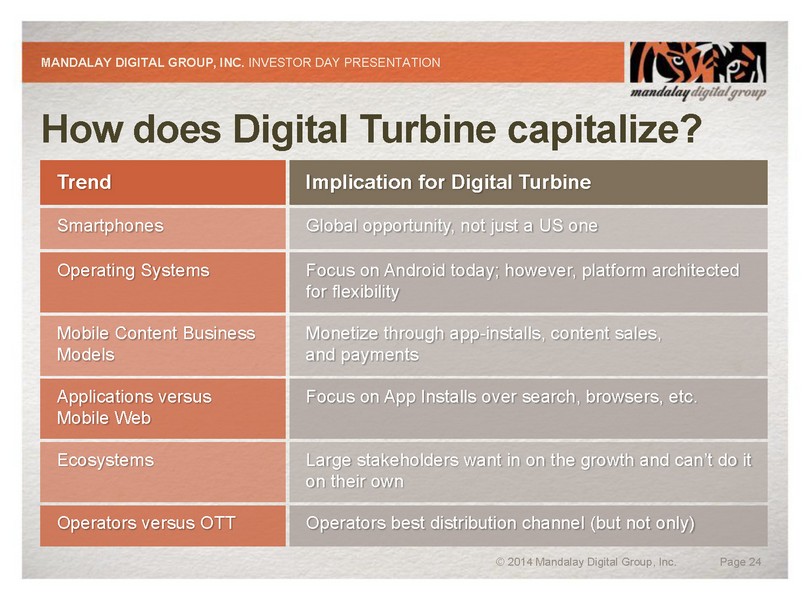
How does Digital Turbine capitalize? MANDALAY DIGITAL GROUP, INC. INVESTOR DAY PRESENTATION © 2014 Mandalay Digital Group, Inc. Page 24 Trend Implication for Digital Turbine Smartphones Global opportunity, not just a US one Operating Systems Focus on Android today; however, platform architected for flexibility Mobile Content Business Models Monetize through app - installs, content sales, and payments Applications versus Mobile Web Focus on App Installs over search, browsers, etc. Ecosystems Large stakeholders want in on the growth and can’t do it on their own Operators versus OTT Operators best distribution channel (but not only)
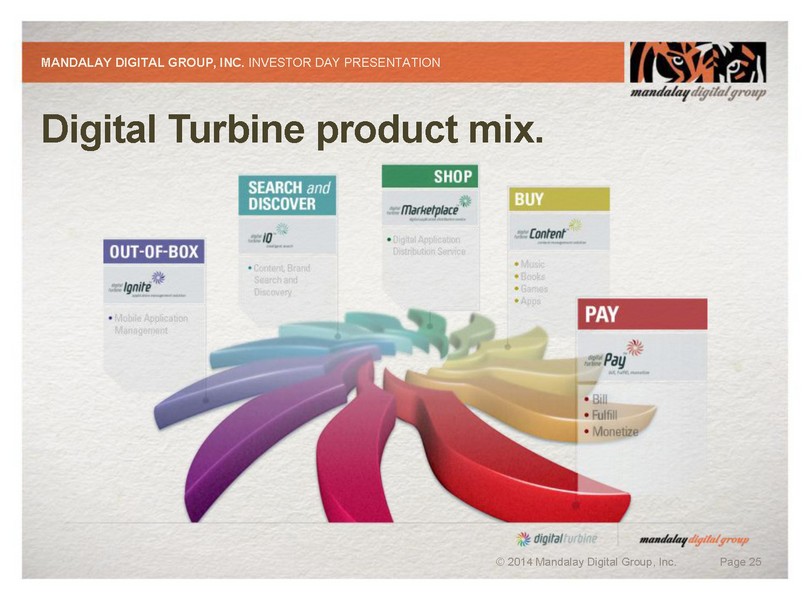
Digital Turbine product mix. MANDALAY DIGITAL GROUP, INC. INVESTOR DAY PRESENTATION © 2014 Mandalay Digital Group, Inc. Page 25
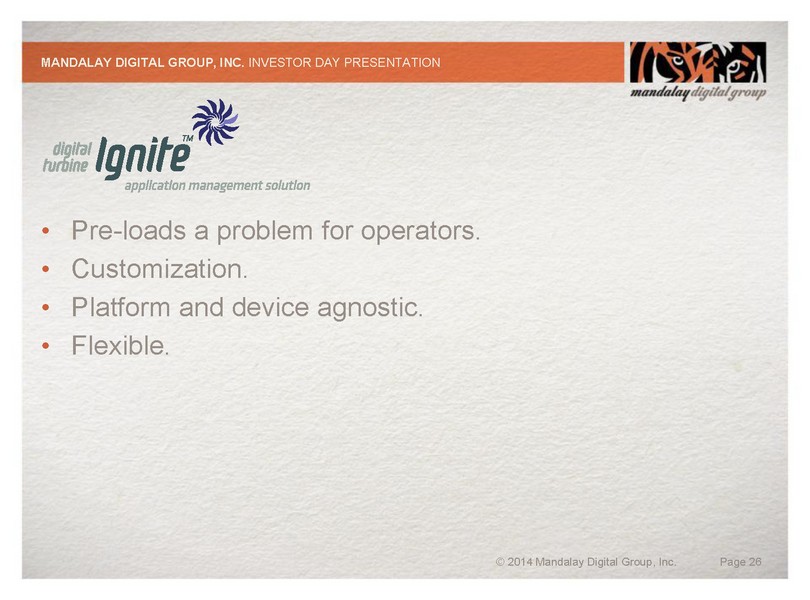
• Pre - loads a problem for operators. • Customization. • Platform and device agnostic. • Flexible. MANDALAY DIGITAL GROUP, INC. INVESTOR DAY PRESENTATION © 2014 Mandalay Digital Group, Inc. Page 26
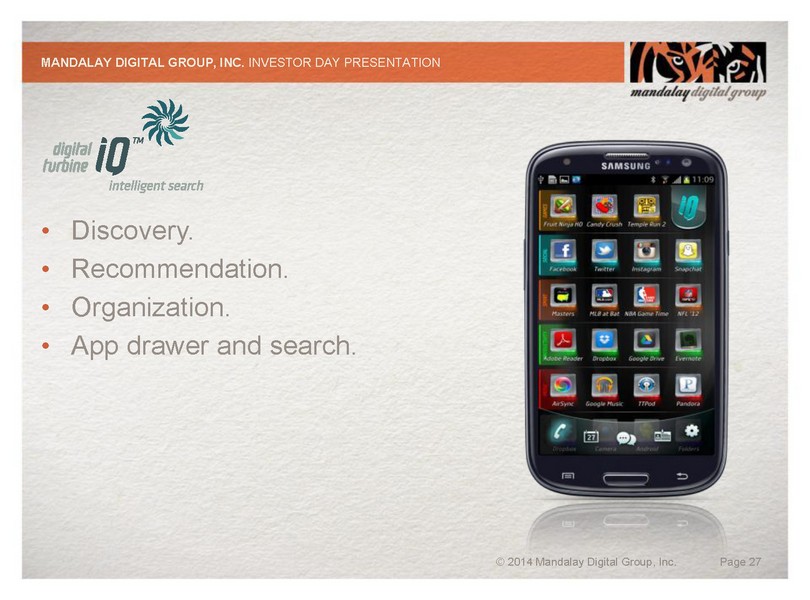
• Discovery. • Recommendation. • Organization. • App drawer and search. MANDALAY DIGITAL GROUP, INC. INVESTOR DAY PRESENTATION © 2014 Mandalay Digital Group, Inc. Page 27
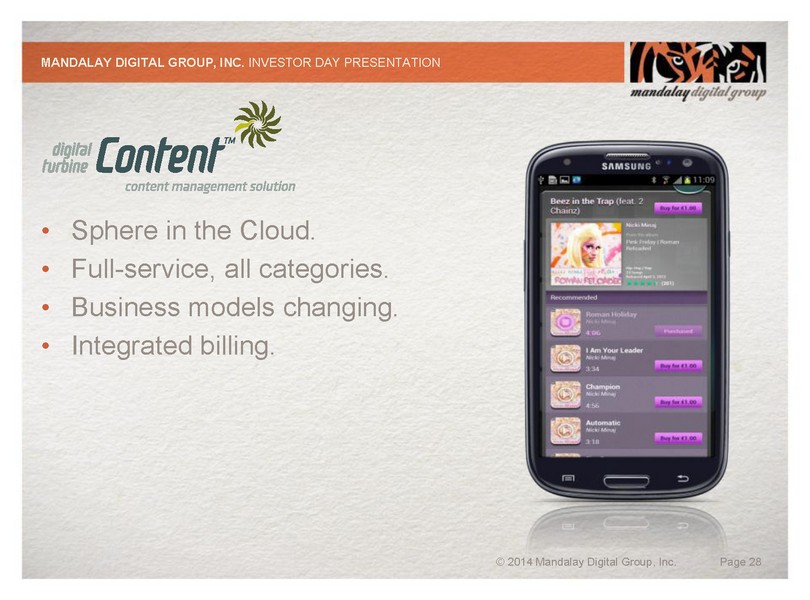
• Sphere in the Cloud. • Full - service , all categories. • Business models changing. • Integrated billing. MANDALAY DIGITAL GROUP, INC. INVESTOR DAY PRESENTATION © 2014 Mandalay Digital Group, Inc. Page 28
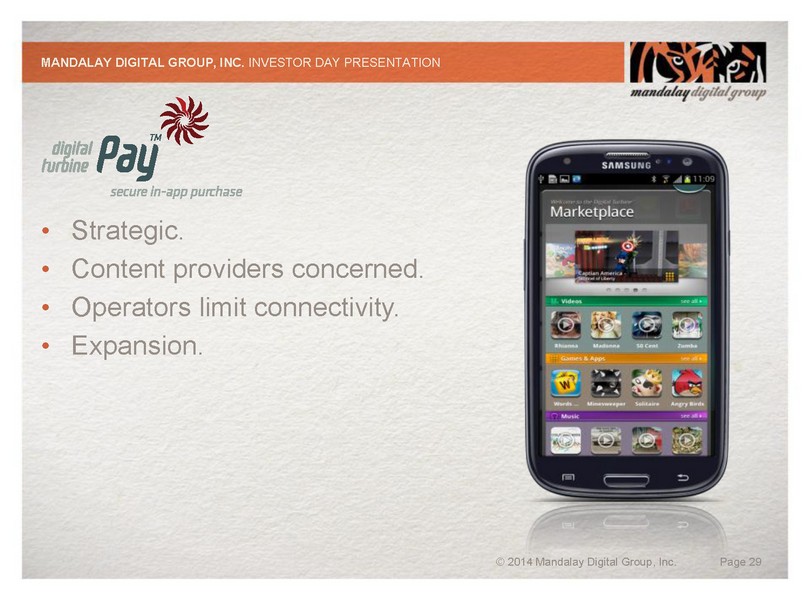
• Strategic. • Content providers concerned. • Operators limit connectivity. • Expansion. MANDALAY DIGITAL GROUP, INC. INVESTOR DAY PRESENTATION © 2014 Mandalay Digital Group, Inc. Page 29
Closing the loop: Bringing the products together. • Bundled versus a - la - carte. • Today versus tomorrow. • Google Play problem. • Revenue “double - dipping”. MANDALAY DIGITAL GROUP, INC. INVESTOR DAY PRESENTATION © 2014 Mandalay Digital Group, Inc. Page 30
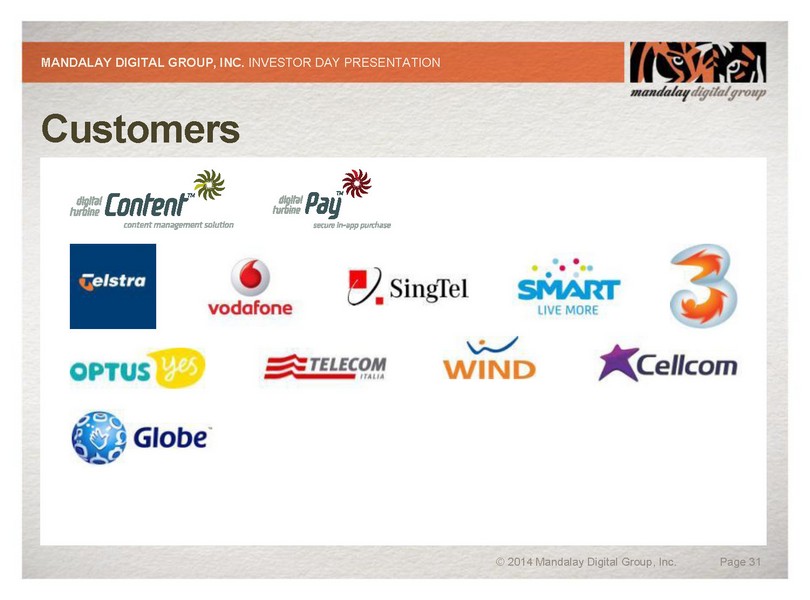
Customers MANDALAY DIGITAL GROUP, INC. INVESTOR DAY PRESENTATION © 2014 Mandalay Digital Group, Inc. Page 31
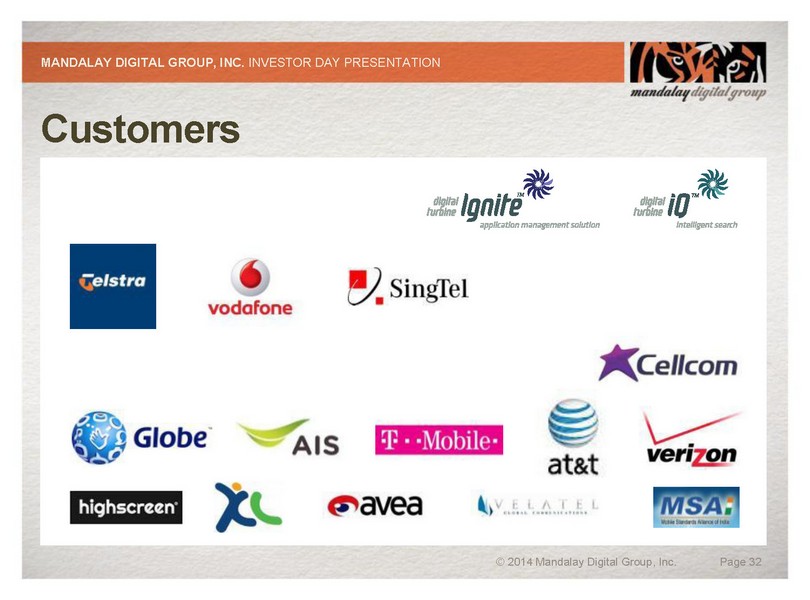
Customers MANDALAY DIGITAL GROUP, INC. INVESTOR DAY PRESENTATION © 2014 Mandalay Digital Group, Inc. Page 32
Media. • >$5M of media sold to date for summer device launches globally. • Strong demand from advertisers. • CPI ranges from $.50 (India) to $3.00 (USA ). • Across multiple categories (eg: games, travel, etc. ). • Open rates ? MANDALAY DIGITAL GROUP, INC. INVESTOR DAY PRESENTATION © 2014 Mandalay Digital Group, Inc. Page 33
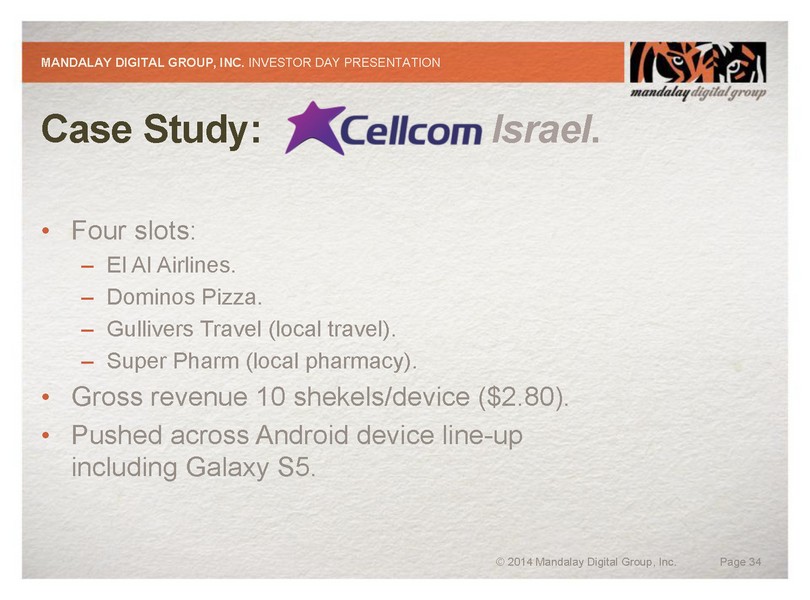
Case Study: Israel . • Four slots: – El Al Airlines. – Dominos Pizza. – Gullivers Travel (local travel ). – Super Pharm (local pharmacy ). • Gross revenue 10 shekels/device ($2.80 ). • Pushed across Android device line - u p including Galaxy S5. MANDALAY DIGITAL GROUP, INC. INVESTOR DAY PRESENTATION © 2014 Mandalay Digital Group, Inc. Page 34
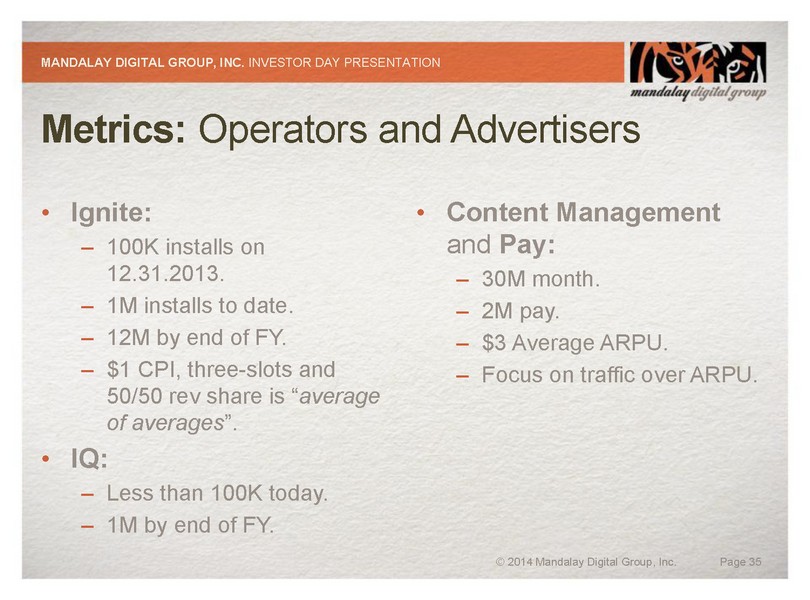
Metrics: Operators and Advertisers • Ignite: – 100K installs on 12.31.2013. – 1M installs to date. – 12M by end of FY. – $1 CPI, three - slots and 50/50 rev share is “ average of averages ”. • IQ: – Less than 100K today. – 1M by end of FY . • Content Management and Pay: – 30M month. – 2M pay. – $3 Average ARPU. – Focus on traffic over ARPU. MANDALAY DIGITAL GROUP, INC. INVESTOR DAY PRESENTATION © 2014 Mandalay Digital Group, Inc. Page 35

Q and A Session.

Corporate Finance Andrew Schleimer
The Past – a complex story to tell. • Former ‘shell’ c ompany. • OTC - listed – not on major exchange until June 2013. • Virtually nil liquidity. • Organic and inorganic growth financed privately by high net - worth individuals. • Private placements of convertible debt and equity with warrants. MANDALAY DIGITAL GROUP, INC. INVESTOR DAY PRESENTATION © 2014 Mandalay Digital Group, Inc. Page 38
The Past – a complex story to tell. • Closely - held ‘quasi private’ company , no real institutional support. • Company built through acquisitions, with a number of starts and stops. • Former shell status, restructuring of ValueAct debt , subsequent acquisitions and private financings resulted in complex capital structure. MANDALAY DIGITAL GROUP, INC. INVESTOR DAY PRESENTATION © 2014 Mandalay Digital Group, Inc. Page 39
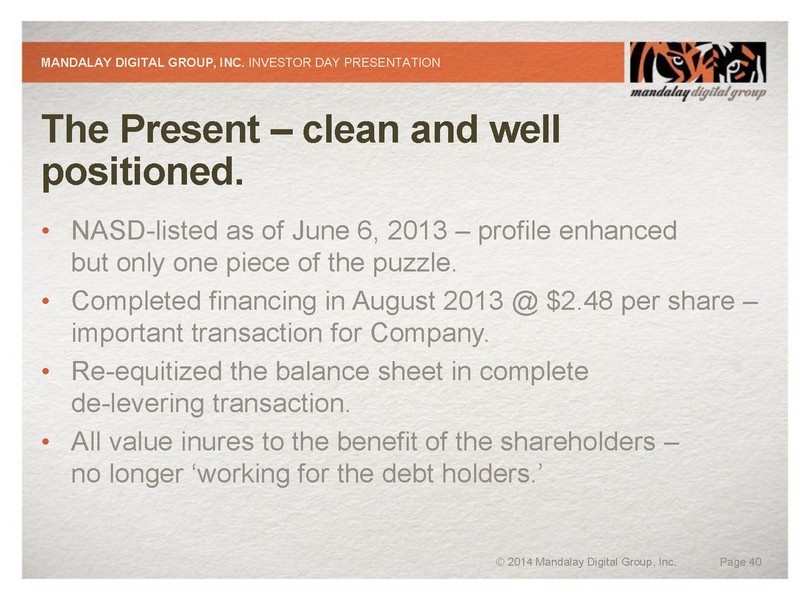
The Present – clean and well positioned. • NASD - listed as of June 6, 2013 – profile enhanced but only one piece of the puzzle. • Completed financing in August 2013 @ $2.48 per share – important transaction for Company. • Re - equitized the balance sheet in complete de - levering transaction. • All value inures to the benefit of the shareholders – no longer ‘working for the debt holders.’ MANDALAY DIGITAL GROUP, INC. INVESTOR DAY PRESENTATION © 2014 Mandalay Digital Group, Inc. Page 40
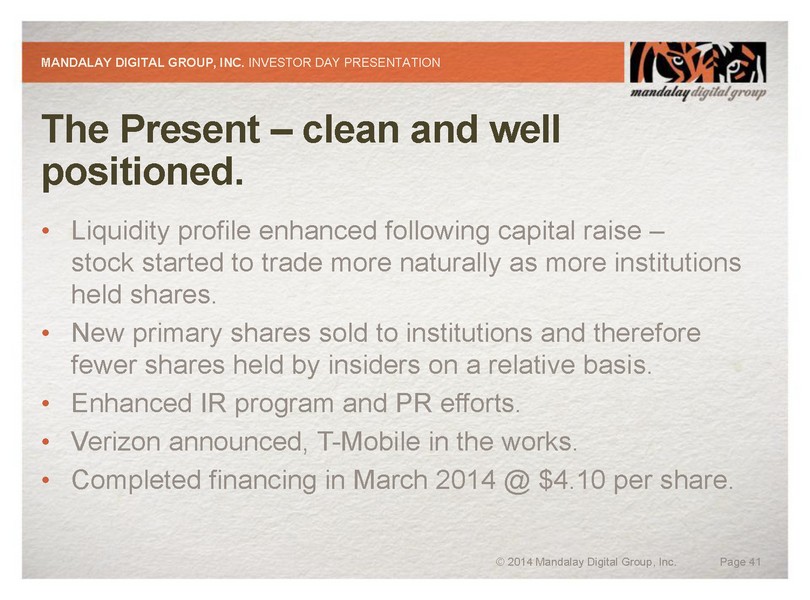
The Present – clean and well positioned. • Liquidity profile enhanced following capital raise – stock started to trade more naturally as more institutions held shares. • New primary shares sold to institutions and therefore fewer shares held by insiders on a relative basis. • Enhanced IR program and PR efforts. • Verizon announced, T - Mobile in the works. • Completed financing in March 2014 @ $4.10 per share. MANDALAY DIGITAL GROUP, INC. INVESTOR DAY PRESENTATION © 2014 Mandalay Digital Group, Inc. Page 41
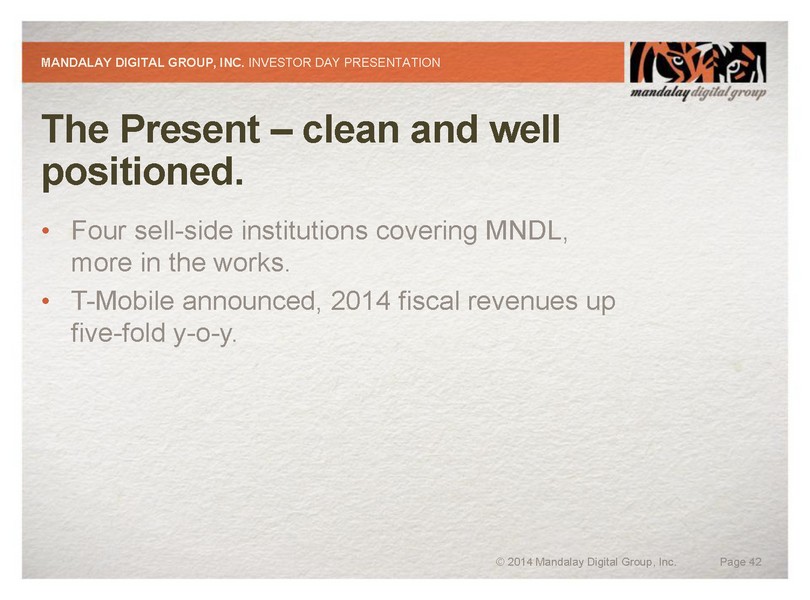
The Present – clean and well positioned. • Four sell - side institutions covering MNDL, more in the works. • T - Mobile announced, 2014 fiscal revenues up five - fold y - o - y. MANDALAY DIGITAL GROUP, INC. INVESTOR DAY PRESENTATION © 2014 Mandalay Digital Group, Inc. Page 42
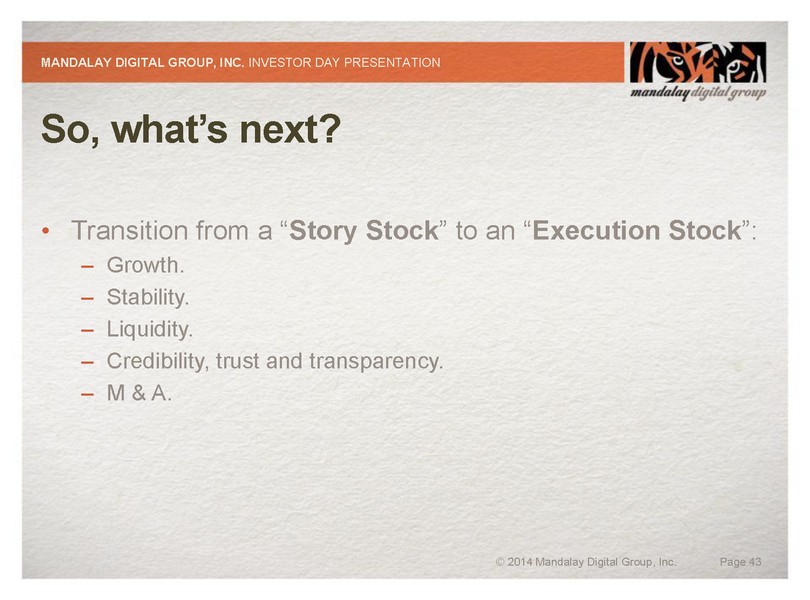
So, what’s next? • Transition from a “ Story Stock ” to an “ Execution Stock ”: – Growth. – Stability. – Liquidity. – Credibility, trust and transparency. – M & A. MANDALAY DIGITAL GROUP, INC. INVESTOR DAY PRESENTATION © 2014 Mandalay Digital Group, Inc. Page 43
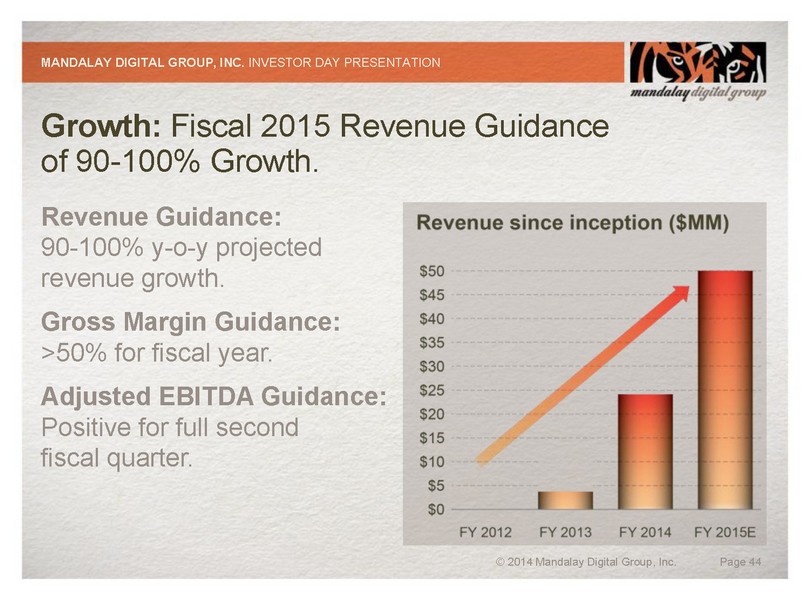
Growth: Fiscal 2015 Revenue Guidance of 90 - 100% Growth. Revenue Guidance: 90 - 100% y - o - y projected revenue growth. Gross Margin Guidance: > 50% for fiscal year. Adjusted EBITDA Guidance: Positive for full second fiscal quarter. MANDALAY DIGITAL GROUP, INC. INVESTOR DAY PRESENTATION © 2014 Mandalay Digital Group, Inc. Page 44
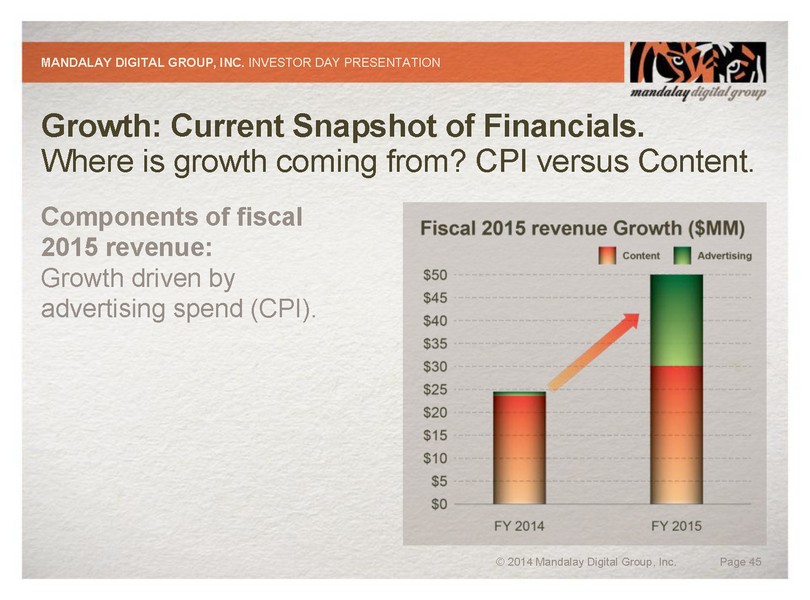
Growth: Current Snapshot of Financials . Where is growth coming from? CPI versus Content. Components of fiscal 2015 revenue: Growth driven by advertising spend (CPI ). MANDALAY DIGITAL GROUP, INC. INVESTOR DAY PRESENTATION © 2014 Mandalay Digital Group, Inc. Page 45
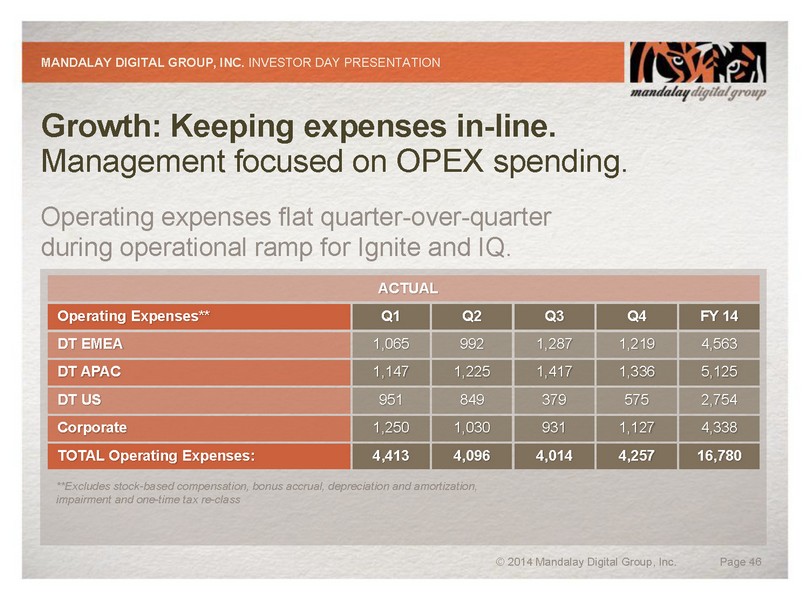
Growth : Keeping expenses in - line . Management focused on OPEX spending. Operating expenses flat quarter - over - quarter during operational ramp for Ignite and IQ. MANDALAY DIGITAL GROUP, INC. INVESTOR DAY PRESENTATION © 2014 Mandalay Digital Group, Inc. Page 46 Operating Expenses** Q1 ACTUAL Q2 Q3 Q4 FY 14 DT EMEA 1,065 992 1,287 1,219 4,563 DT APAC 1,147 1,225 1,417 1,336 5,125 DT US 951 849 379 575 2,754 C orporate 1,250 1,030 931 1,127 4,338 TOTAL Operating Expenses: 4,413 4,096 4,014 4,257 16,780 **Excludes stock - based compensation, bonus accrual, depreciation and amortization, impairment and one - time tax re - class
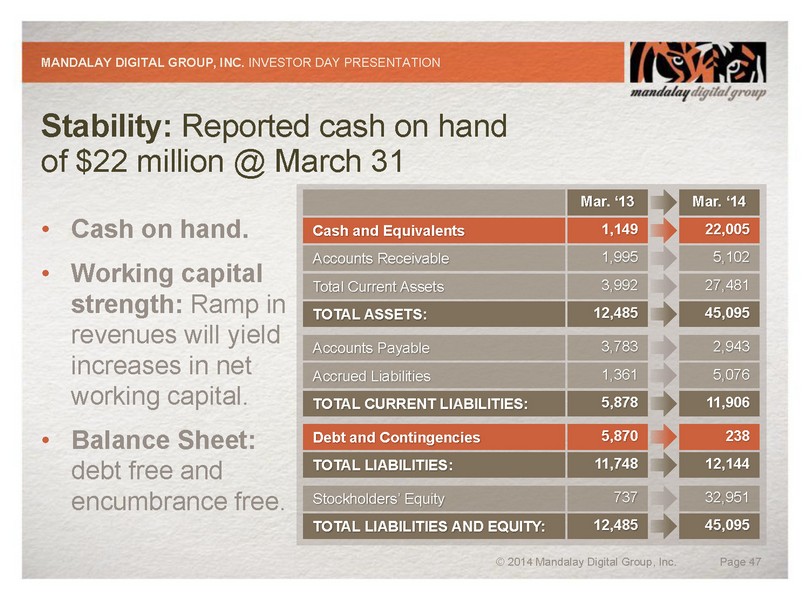
Stability: Reported cash on hand of $22 million @ March 31 MANDALAY DIGITAL GROUP, INC. INVESTOR DAY PRESENTATION © 2014 Mandalay Digital Group, Inc. Page 47 Mar. ‘14 5,102 27,481 45,095 • Cash on hand. • Working capital strength: Ramp in revenues will yield increases in net working capital. • Balance Sheet: debt free and encumbrance free. 22,005 2,943 5,076 11,906 238 12,144 32,951 45,095 Mar. ‘13 1,995 3,992 12,485 1,149 3,783 1,361 5,878 5,870 11,748 737 12,485 Accounts Receivable Total Current Assets TOTAL ASSETS: Cash and Equivalents Accounts Payable Accrued Liabilities TOTAL CURRENT LIABILITIES: Debt and Contingencies TOTAL LIABILITIES: Stockholders’ Equity TOTAL LIABILITIES AND EQUITY:
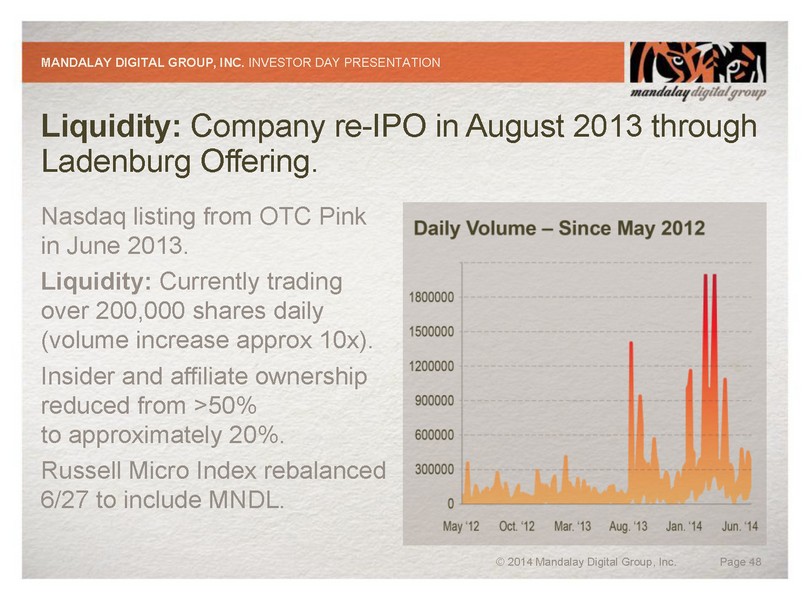
Liquidity: Company re - IPO in August 2013 through Ladenburg Offering. Nasdaq listing from OTC Pink in June 2013. Liquidity: Currently trading over 200,000 shares daily (volume increase approx 10x ) . Insider and affiliate ownership reduced from >50% to approximately 20 %. Russell Micro Index rebalanced 6/27 to include MNDL. MANDALAY DIGITAL GROUP, INC. INVESTOR DAY PRESENTATION © 2014 Mandalay Digital Group, Inc. Page 48
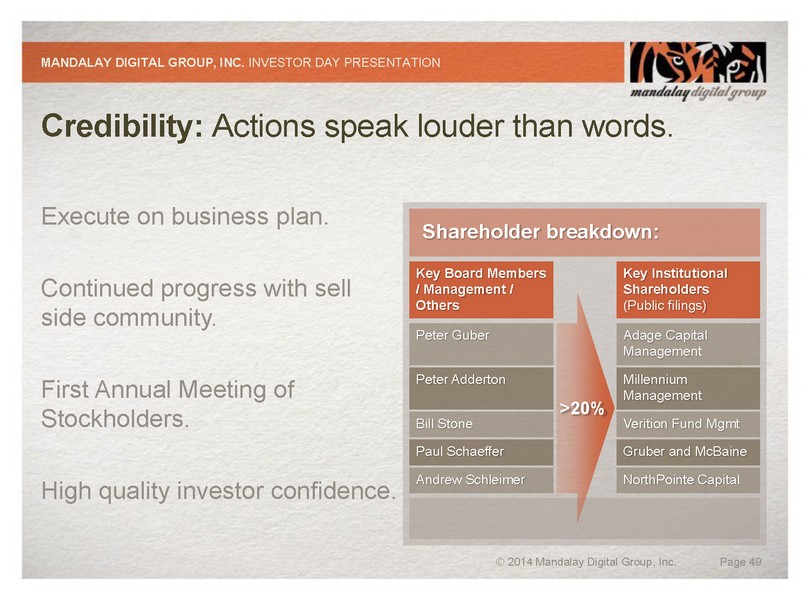
Credibility: Actions speak louder than words. Execute on business plan. Continued progress with sell side community. First Annual Meeting of Stockholders. High quality investor confidence. MANDALAY DIGITAL GROUP, INC. INVESTOR DAY PRESENTATION © 2014 Mandalay Digital Group, Inc. Page 49 Peter Guber Key Board Members / Management / Others Peter Adderton Bill Stone Paul Schaeffer Andrew Schleimer Adage Capital Management Key Institutional Shareholders (Public filings) Verition Fund Mgmt Gruber and McBaine NorthPointe Capital Millennium Management >20 % Shareholder breakdown:
M & A. • March capital raise primarily for M & A: – $22 million of cash on hand at March 31. – Continued progress on a number of potential transactions. – Management disciplined approach. – View each opportunity through lens of financial and strategic accretion. MANDALAY DIGITAL GROUP, INC. INVESTOR DAY PRESENTATION © 2014 Mandalay Digital Group, Inc. Page 50
Revenue and Gross margin Kirstie Brown

Revenue Models: Content and Advertising. Content MANDALAY DIGITAL GROUP, INC. INVESTOR DAY PRESENTATION Advertising © 2014 Mandalay Digital Group, Inc. Page 52

Growth: Current Snapshot of Financials . Where is growth coming from? CPI versus Content. Components of fiscal 2015 revenue: Growth driven by advertising spend (CPI ). MANDALAY DIGITAL GROUP, INC. INVESTOR DAY PRESENTATION © 2014 Mandalay Digital Group, Inc. Page 53
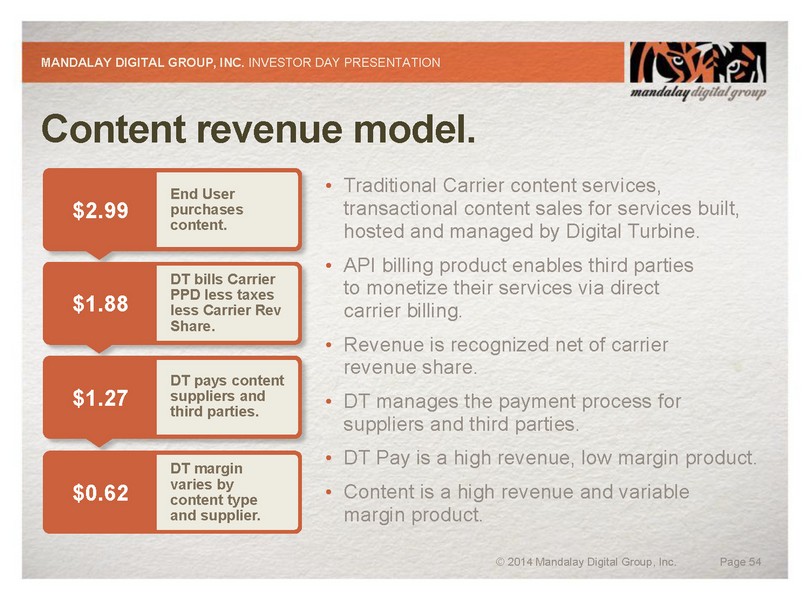
Content revenue model. End User purchases content. • Traditional Carrier content services, transactional content sales for services built, hosted and managed by Digital Turbine. • API billing product enables third parties to monetize their services via direct carrier billing. • Revenue is recognized net of carrier revenue share. • DT manages the payment process for suppliers and third parties. • DT Pay is a high revenue, low margin product. • Content is a high revenue and variable margin product. MANDALAY DIGITAL GROUP, INC. INVESTOR DAY PRESENTATION © 2014 Mandalay Digital Group, Inc. Page 54 $2.99 $1.88 DT bills Carrier PPD less t axes less C arrier R ev Share. $1.27 DT pays content suppliers and third parties. $0.62 DT margin varies by content type and supplier.
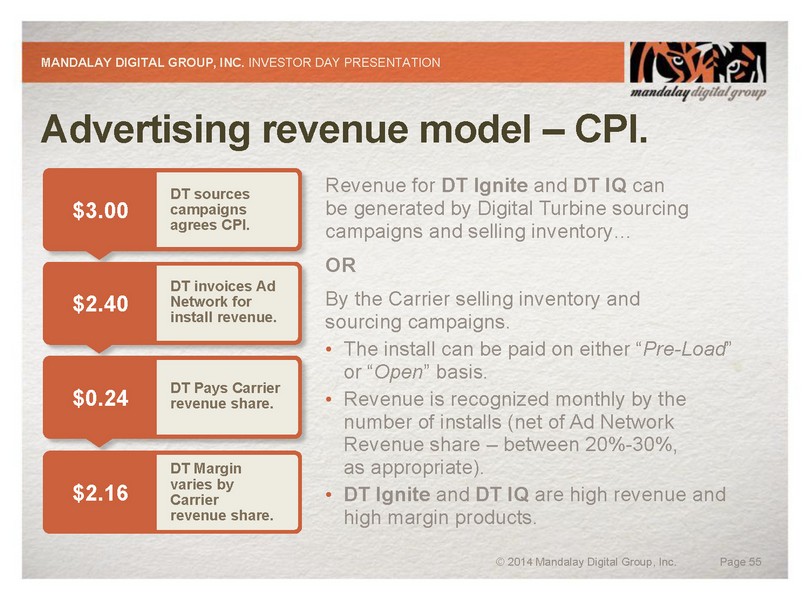
Advertising revenue model – CPI. DT sources campaigns agrees CPI. Revenue for DT Ignite and DT IQ can be generated by Digital Turbine sourcing campaigns and selling inventory… OR By the Carrier selling inventory and sourcing campaigns. • The install can be paid on either “ Pre - Load ” or “ Open ” basis. • Revenue is recognized monthly by the number of installs (net of Ad Network Revenue share – between 20% - 30%, as appropriate ). • DT Ignite and DT IQ are high revenue and high margin products. MANDALAY DIGITAL GROUP, INC. INVESTOR DAY PRESENTATION © 2014 Mandalay Digital Group, Inc. Page 55 $3.00 $2.40 DT invoices Ad Network for install revenue . $0.24 DT Pays Carrier revenue share. $2.16 DT Margin varies by Carrier revenue share.
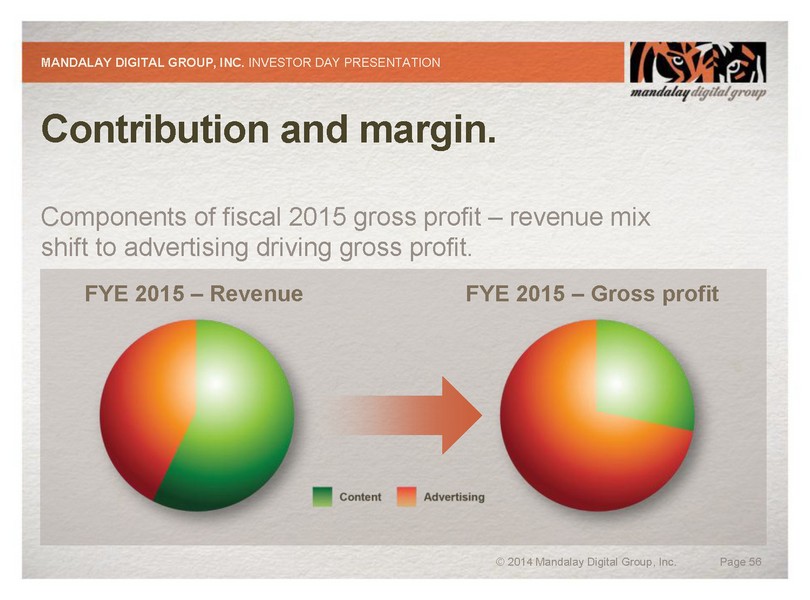
Contribution and margin. Components of fiscal 2015 gross profit – revenue mix shift to advertising driving gross profit. MANDALAY DIGITAL GROUP, INC. INVESTOR DAY PRESENTATION © 2014 Mandalay Digital Group, Inc. Page 56 FYE 2015 – Revenue FYE 2015 – Gross profit

Q and A Session.

Appia, Inc. Jud Bowman

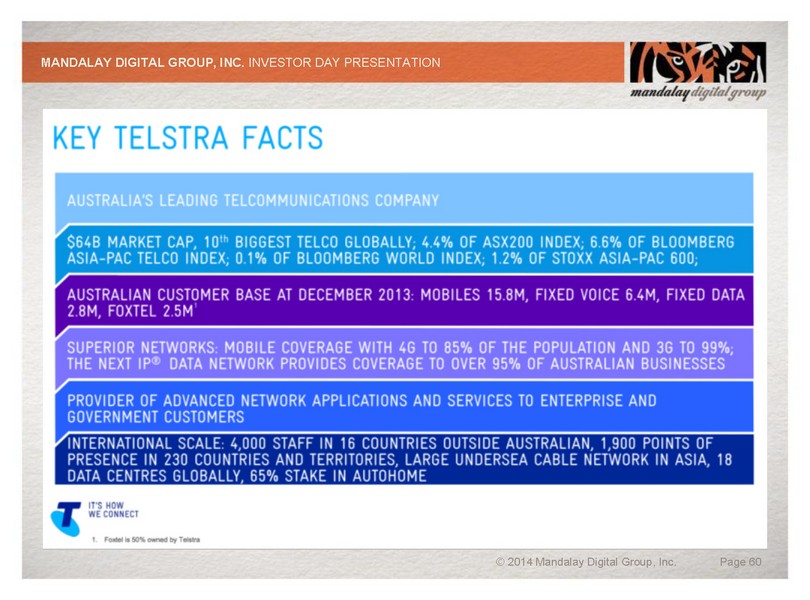
Telstra Corporation Stuart Bird
MANDALAY DIGITAL GROUP, INC. INVESTOR DAY PRESENTATION © 2014 Mandalay Digital Group, Inc. Page 60
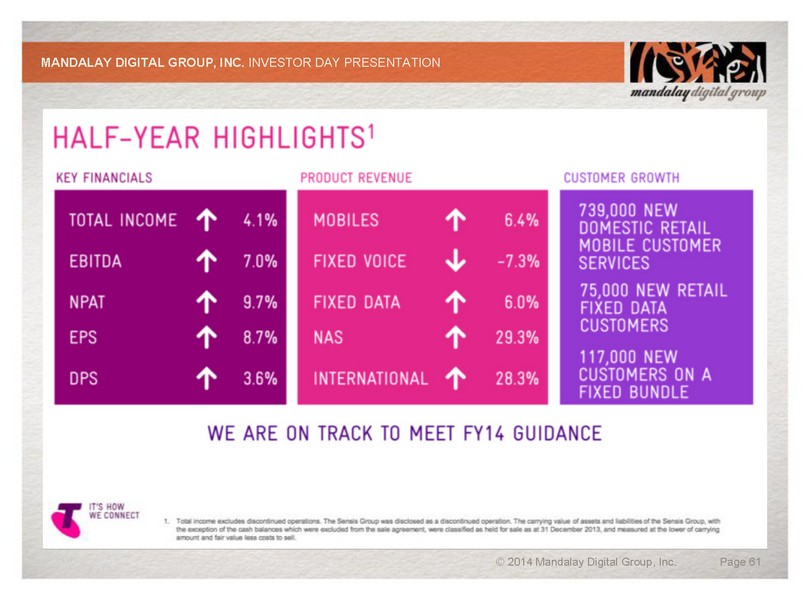
MANDALAY DIGITAL GROUP, INC. INVESTOR DAY PRESENTATION © 2014 Mandalay Digital Group, Inc. Page 61
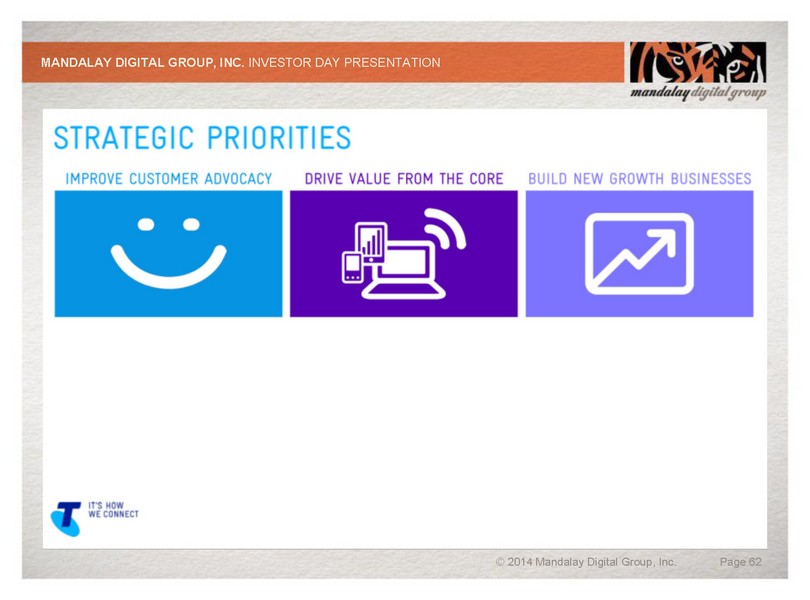
MANDALAY DIGITAL GROUP, INC. INVESTOR DAY PRESENTATION © 2014 Mandalay Digital Group, Inc. Page 62
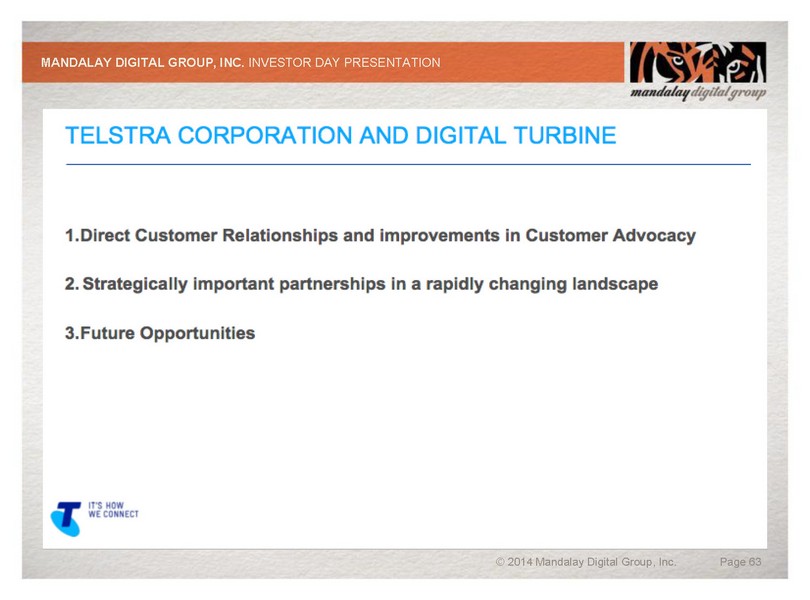
MANDALAY DIGITAL GROUP, INC. INVESTOR DAY PRESENTATION © 2014 Mandalay Digital Group, Inc. Page 63
Additional Customer Insight